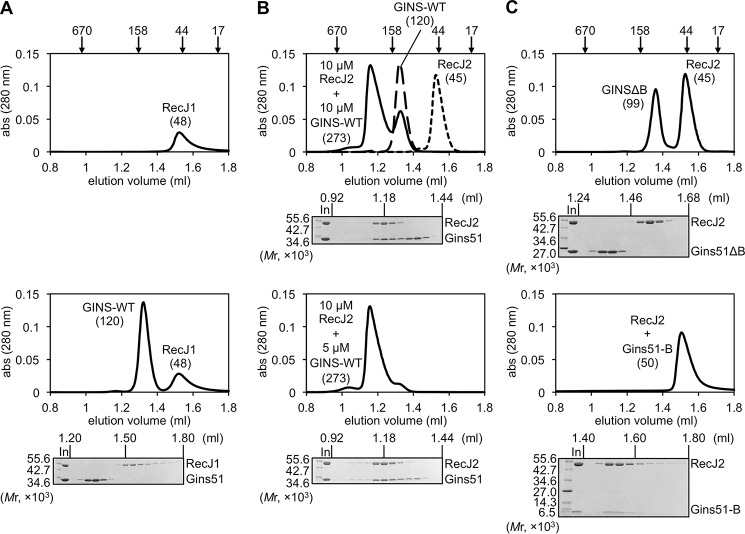
Figure 4.
Physical interactions between TaGINS and TaRecJs. The physical interactions between TaGINS and TaRecJs were analyzed by gel filtration using a Superdex 200 3.2/30 column pre-equilibrated with 10 mm HEPES-NaOH, pH 7.5, and 0.15 m NaCl. The loading volume was 20 μl. The elution profiles, monitored by the absorbance at 280 nm, are shown. The peak positions of the marker proteins are indicated on the top. Aliquots (10 μl) of each fraction from the eluates were subjected to 10–20% SDS-PAGE followed by Coomassie Brilliant Blue staining. A, TaRecJ1 (10 μm) or the mixture of TaRecJ1 and TaGINS-WT (10 μm each) was applied to the column, and the elution profiles were shown in the upper and lower panels, respectively. B, the elution profiles of TaRecJ2 (10 μm), TaGINS-WT (10 μm), and the mixture of TaRecJ2 (10 μm) and TaGINS-WT (10 μm) are shown in the upper panel, and that of the mixture of TaRecJ2 (10 μm) and TaGINS-WT (5 μm) was shown in the lower column. C, the elution profiles of the mixture of TaRecJ2 (10 μm) and TaGINSΔB (10 μm), and the mixture of TaRecJ2 (10 μm) and TaGINS-B-domain (10 μm) is shown in the upper and lower panels, respectively.

