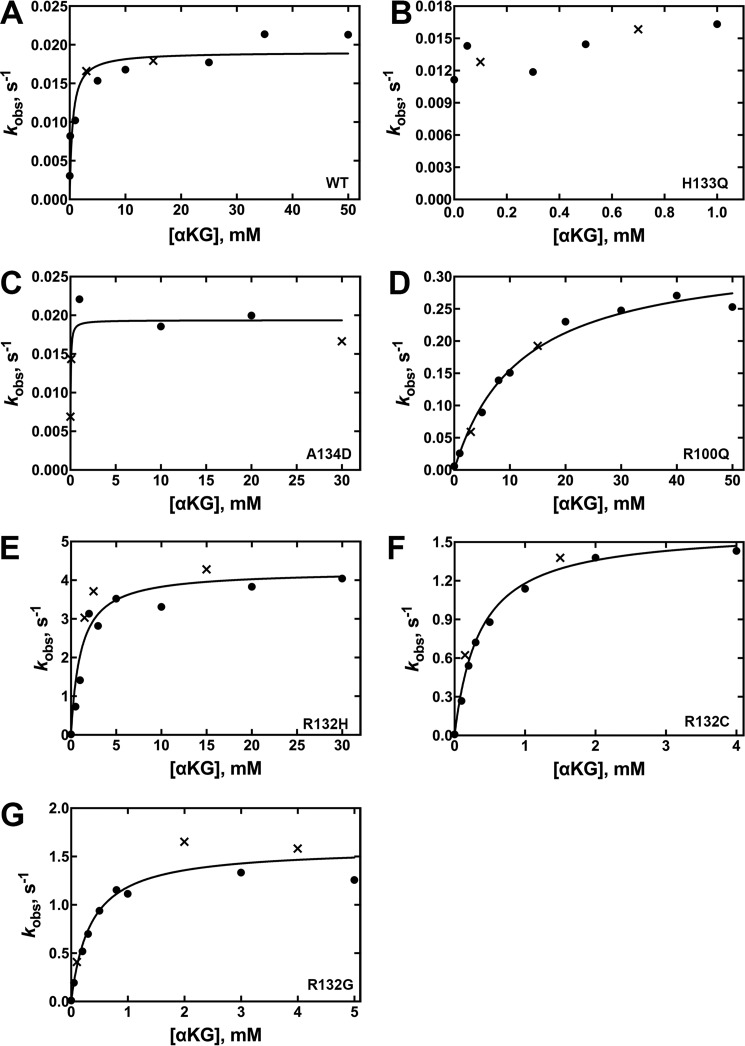
Figure 4.
Concentration dependence of αKG concentration on the observed rate of NADPH depletion in the neomorphic reaction (37 °C). The determined kobs values were obtained from two different enzyme preparations to ensure reproducibility. The kobs values resulting from each of the two enzyme preparations are distinguished by using either a circle or an × in the plots. The observed rate constants (kobs) were calculated from the linear range of the slopes of plots of concentration versus time using GraphPad Prism software (GraphPad). These kobs values were then fit to a hyperbolic equation to generate kcat and Km values, and the S.E. results from the deviance from these hyperbolic fits is indicated. Km values and efficiency are in terms of [αKG]. Due to limits of detection, Km values could not be obtained for low efficiency IDH1 enzymes because only saturating kobs rates could be detected. In this case, kobs rates are reported, which approximate kcat rates. Results from assays at 21 °C are shown in supplemental Fig. S4. A, WT IDH1. B, H133Q IDH1. D, R100Q IDH1. E, R132H IDH1. F, R132C IDH1. G, R132G IDH1.

