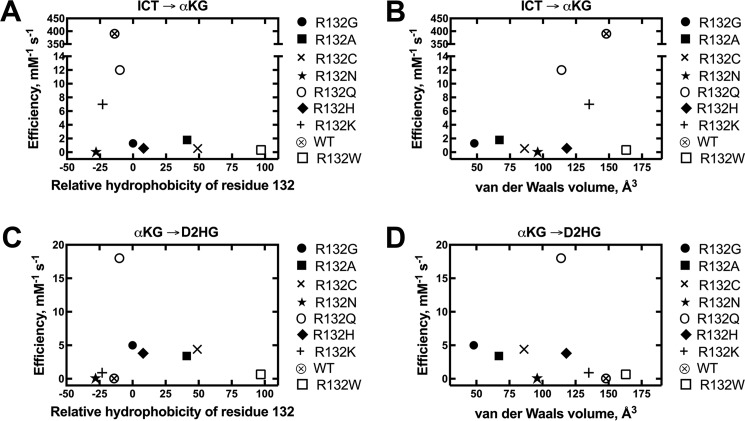
Figure 7.
Comparisons of catalytic efficiency by IDH1 with mutations at residue 132. The observed rate constants (kobs) were calculated from the linear range of the slopes of plots of concentration versus time, and then fit to a hyperbolic equation to generate kcat and Km values. All experiments were performed at 37 °C. These catalytic parameters result from fits of kinetic data resulting from two different enzyme preparations to ensure reproducibility. A, relative catalytic efficiencies (kcat/Km) of the conversion of ICT to αKG using Km values for ICT are plotted against relative hydrophobicity (43). B, relative catalytic efficiencies (kcat/Km) of the conversion of ICT to αKG using Km values for ICT are plotted against van der Waals volume (44). C, relative catalytic efficiencies (kcat/Km) of the conversion of αKG to D2HG using Km values for αKG are plotted against relative hydrophobicity (43). D, relative catalytic efficiencies (kcat/Km) of the conversion of αKG to D2HG using Km values for αKG are plotted against van der Waals volume (44).

