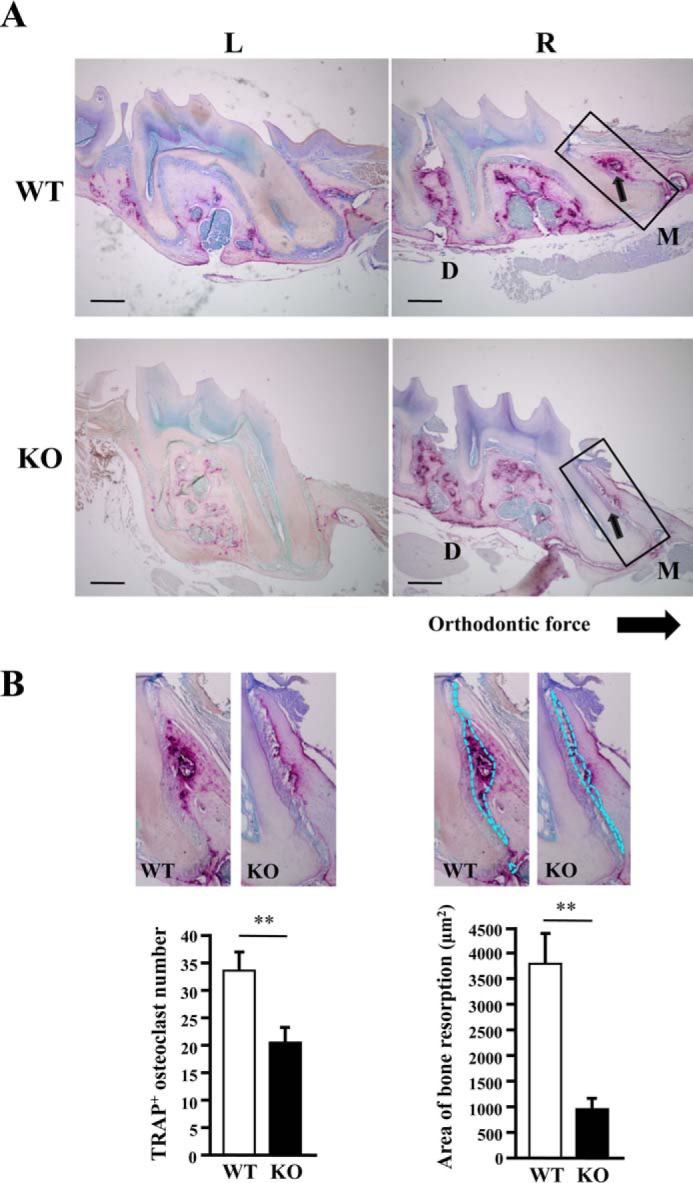
Figure 2.

Histological analysis of maxillary bones. A, sagittal sections of maxillary bone around the first molar, analyzed in Fig. 1, were stained for TRAP. Arrows indicate TRAP-positive osteoclasts and bone resorption lacunae. R, right side, with mechanical loading; L, left side, without mechanical loading; M, mesial/pressure side; D, distal/tension side. Areas outlined with rectangles are enlarged in B. B, the left panel shows the enlarged images of TRAP-positive (TRAP+) cells on the pressure side in sagittal sections of maxillary bone and a graph of the number of TRAP+ cells in the peripheral region of lacunae (0.5 mm2). The right panel shows the same images with bone resorption lacunae outlined with dotted lines and a graph of the area of the lacunae on the pressure side. Data are shown as the mean ± S.D. of the results from several sections of five male mice each. Data from female mice were similar (not shown). **, p < 0.01. Bar = 200 μm.
