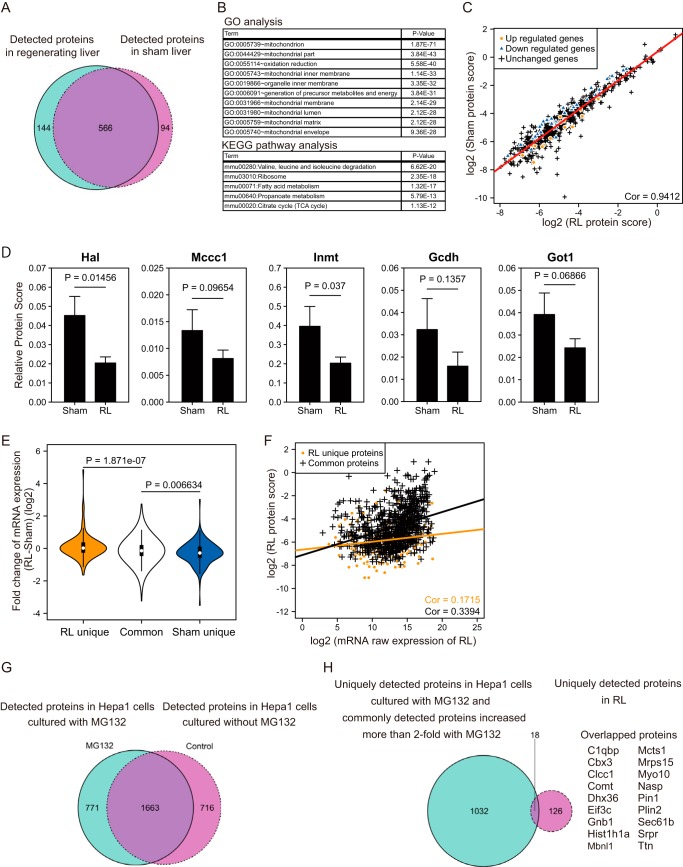
Figure 10.
Analysis of protein expression profiles during liver regeneration by nano-HPLC-MS/MS. A, the Venn diagram represents the number of proteins detected in each condition. B, GO and KEGG pathway analysis of proteins detected in both conditions. C, scatter plot depicting protein scores of detected proteins in the regenerating and sham livers. The Pearson correlation coefficient is indicated. The regression line is shown as a red line. Orange dots and blue triangles indicate proteins whose corresponding mRNA expression was altered significantly in the microarray analysis in Fig. 2, and black crosses indicate proteins without transcriptional change. D, bar plots represent the relative protein scores of enzymes involved in various metabolic functions (Hal, histidine ammonia-lyase; Mccc1, methylcrotonoyl-CoA carboxylase 1; Inmt, indolethylamine N-methyltransferase; Gcdh, glutaryl-CoA dehydrogenase; Got1, glutamic-oxaloacetic transaminase 1). The mean values and S.D. (error bars) of three independent experiments are shown. Statistical significance was determined using the Student's t test, and p values are indicated. Sham, sham liver. E, violin plots represent the -fold changes of mRNA of proteins detected only in regenerating livers or sham livers or in both. Statistical significance was determined by Student's t test, and p values are indicated. F, scatter plot depicting the raw expression scores of mRNA and protein scores in regenerating liver. Proteins that were commonly detected in the two conditions or uniquely detected in RL are shown as a black or orange line, respectively. Their regression lines are indicated with the respective colors. Values of the Pearson correlation coefficient are also shown. G, the Venn diagram represents the number of proteins detected in Hepa1 cells. Hepa1 cells were treated with or without MG132 for 12 h before extraction of proteins. H, the Venn diagram represents the comparison of the RL-unique proteins and MG132-induced proteins. For the latter set, we combined proteins uniquely detected in MG132-treated Hepa1 cells (771 proteins) and proteins that showed > 2-fold increase in response to MG132 (279 proteins). Proteins in the intersection subset were listed alongside.

