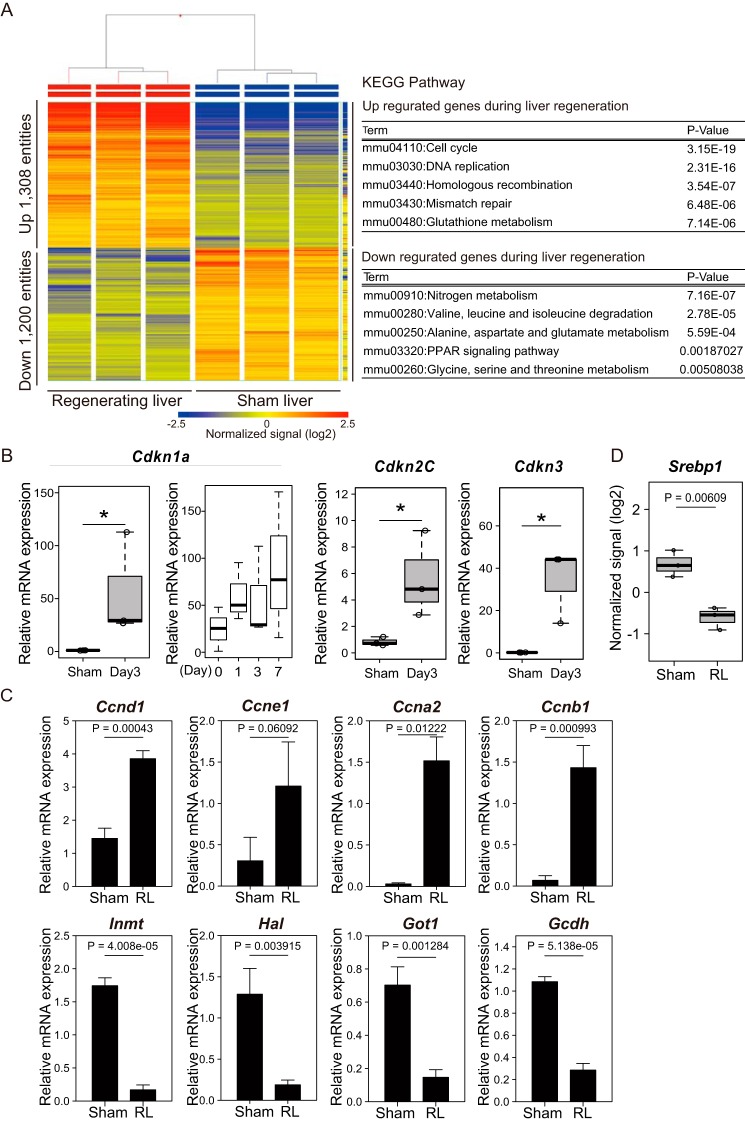
Figure 2.
Analysis of transcriptomic changes during liver regeneration. A, the heat map represents the mRNA expression profiles of the regenerating and sham livers at day 3 after the operation (n = 3 mice/group). The tables show the results of KEGG pathway analysis and list the top five pathway terms sorted by p values for up- and down-regulated genes. The color key indicates normalized signal value on a log2 scale. B and C, the expression of the indicated genes was analyzed by RT-qPCR analysis. The mRNA quantities were normalized to Actb (β-actin) mRNA in each sample. Sham, sham liver, respectively. B, the box-and-whisker plots show the 25th and 75th percentile quartiles and median values (center black line) and maximum and minimum values of the data. Statistical significance was determined using the Mann-Whitney U test, and asterisks indicate p < 0.05. Expression of Cdkn1a was also analyzed at the indicated time points. C, the mean values and S.D. (error bars) are shown (n = 3/group). Statistical significance was determined using Student's t test, and p values are indicated. D, box plot shows the mRNA expression levels of Srebp1 extracted from the microarray data of A. The box-and-whisker plots show the 25th and 75th percentile quartiles and median values (center black line) and maximum and minimum values of the data. Statistical significance was determined using Student's t test, and p values are indicated.

