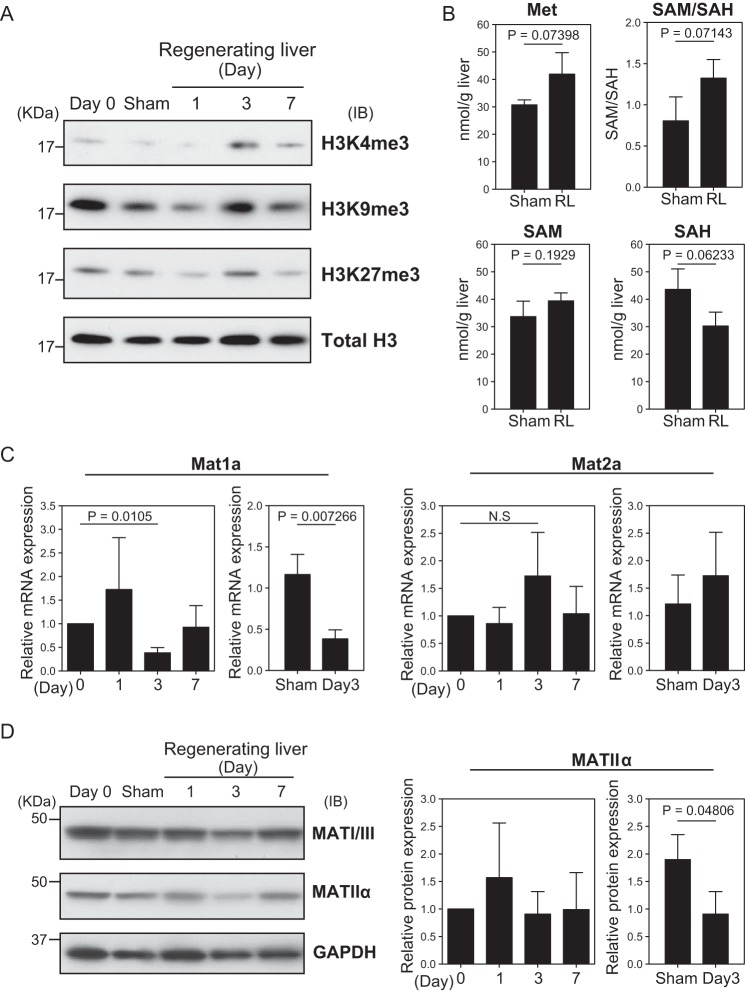
Figure 3.
Analysis of the state of histone H3 methylation and quantification of SAM cycle metabolites. A, immunoblotting analysis of the histone extracts of livers. The livers were isolated from non-treated mice (day 0), those with sham operation (day 3), or those with PVBL at the indicated time points. Immunoblots were performed with antibodies against H3K4me3, H3K9me3, H3K27me3, and total histone H3 as a loading control. Similar results were obtained in three independent experiments. B, the amounts of methionine, S-adenosylmethionine, S-adenosyl-l-homocycteine, and SAM/SAH ratio of the liver. The mean values and S.D. of the results from three mice in the indicated conditions are shown. Statistical significance was determined using Student's t test, and p values are indicated. C, the expression of Mat1a and Mat2a at the indicated time points. The mRNA expression was normalized to Actb mRNA in each sample and is represented as a relative value with regard to that in the day 0 sample. The mean values and S.D. of the results from three mice are shown. Statistical significance between groups was determined using Student's t test, and p values are indicated. N.S, not significant. D, immunoblotting analysis of the whole lysates of regenerating livers. Immunoblots were performed with antibodies against MATI/III, MATIIα, and GAPDH as loading control. The bar plots represent the mean and S.D. (error bars) from the relative intensity of MATIIα protein normalized with GAPDH protein intensity in three mice for each time point. Statistical significance was determined using Student's t test, and the p value is indicated.

