Figure 4.
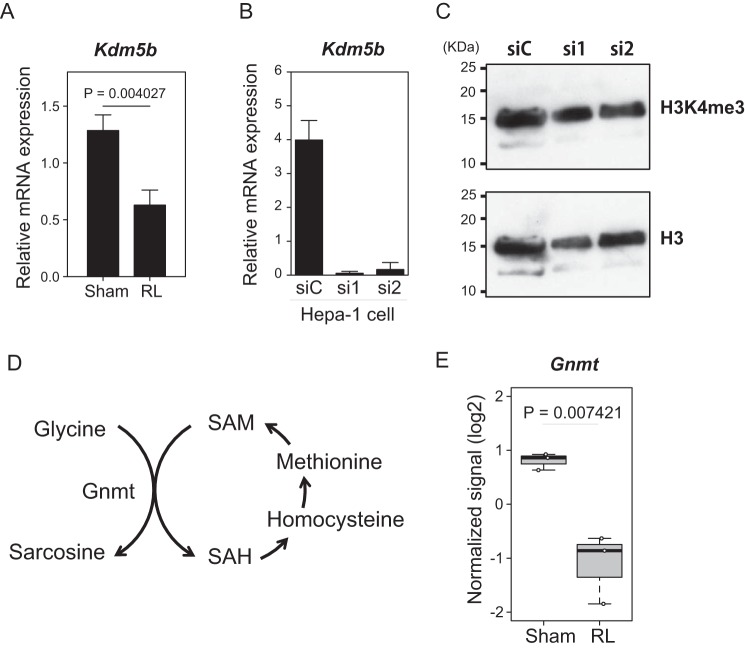
Expression of Kdm5b and Gnmt during liver regeneration. A, mRNA expression of Kdm5b. The mRNA quantities were normalized to Actb mRNA in each sample. The mean values and S.D. (error bars) of the results from three mice are shown. Statistical significance was determined using Student's t test, and p values are indicated. B, effects of the indicated siRNAs targeting Kdm5b (si1 and si2) or control siRNA (siC) in Hepa1 cells. C, immunoblotting analysis of the histone extracts of Hepa1 cells treated with the indicated siRNAs using antibodies specific for histone H3K4me3 (top) or bulk H3 (bottom). D, reaction by Gnmt in SAM metabolism. E, box plot shows the mRNA expression levels of Gnmt extracted from the microarray data of Fig. 2 and depicted as in Fig. 2.

