Figure 5.
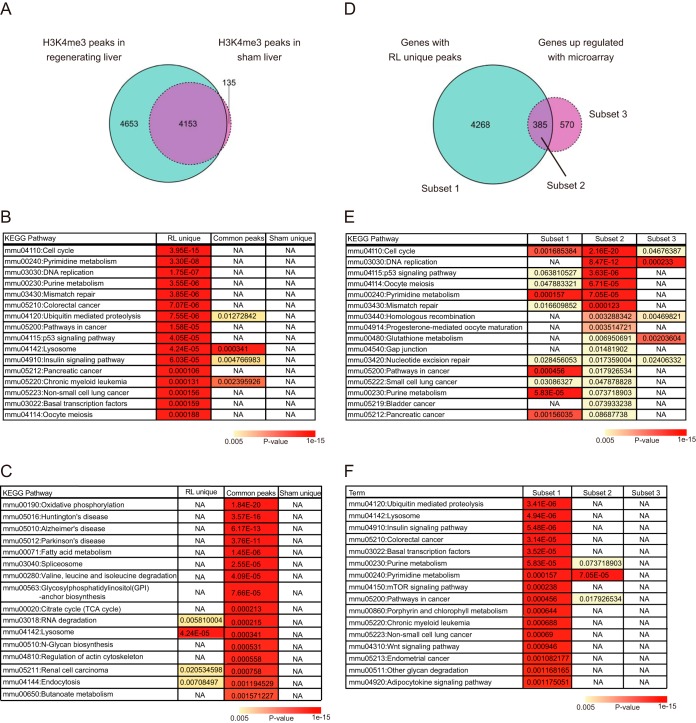
The ChIP-seq analysis of histone H3K4me3. A–C, the number of genes with H3K4me3 peaks in the indicated samples at day 3 after operation (A) and the results of KEGG pathway analysis (B and C). The Venn diagram represents the number of genes with H3K4me3 peaks. The blue and purple circles indicate genes in regenerating liver and sham liver, respectively. The tables represent the KEGG pathway terms significantly enriched in genes with the RL unique peaks. Significance of enrichment of the pathway terms in genes with common and sham-unique peaks is also shown. NA, pathway terms that are not significantly enriched. D–F, comparison between genes with RL unique H3K4me3 peaks (4,653 genes) and those transcriptionally up-regulated in regenerating livers (both at day 3 after operation). The Venn diagram represents the number of genes in each subset (E). The results of KEGG pathway analysis of subsets 2 and 1 are shown in E and F, respectively, with p values of the enriched pathways in other subsets.

