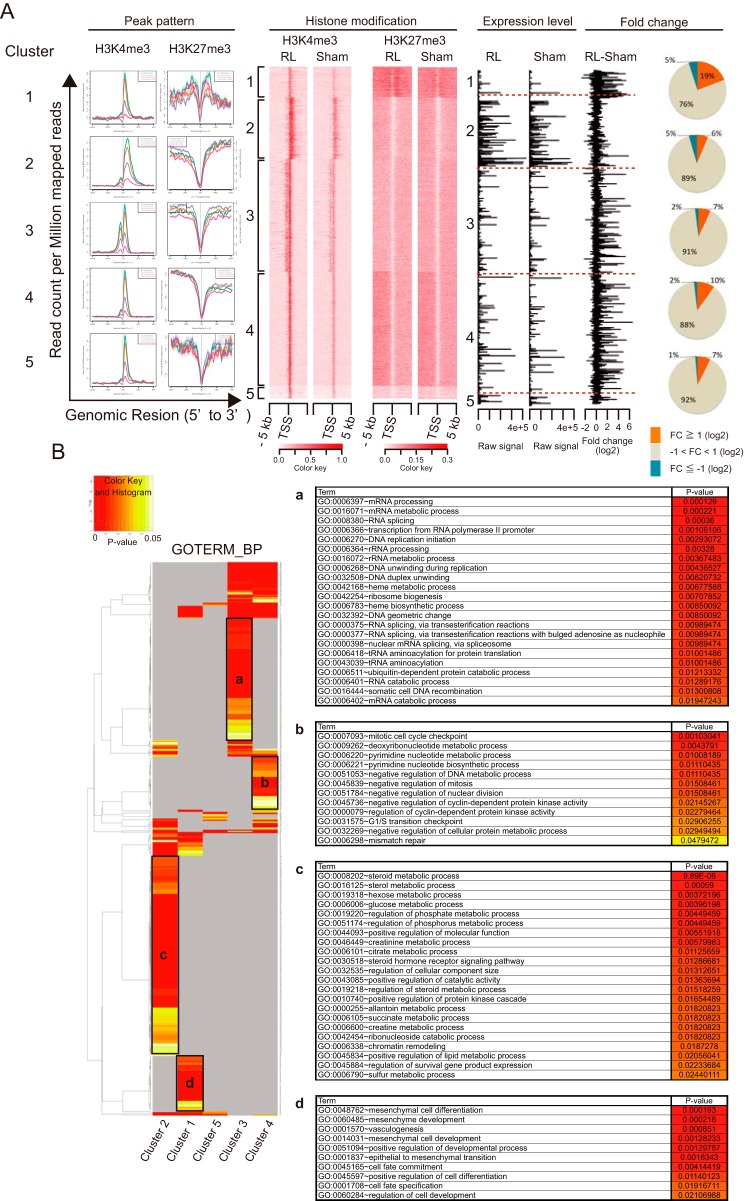
Figure 6.
Classification of genes according to the patterns of histone H3 methylation. A, the genes with H3K4me3 peaks unique to regenerating liver were classified by the patterns of H3K4me3 and H3K27me3 methylation. Line charts represent the pattern of H3K4me3 and H3K27me3 peaks of each cluster. A heat map also represents the patterns of histone methylation, and bar plots represent the raw expression values and -fold change of mRNA expression as revealed by microarray analysis. Pie charts show the proportion of up- and down-regulated genes in each cluster. B, GO analysis of genes in each cluster. The heat map represents p values in the color key of the GO terms enriched in each cluster, and the black boxes indicate the GO terms uniquely enriched in each cluster. A portion of such GO terms characterizing each cluster are shown in the tables on the right (a–d) with p values.

