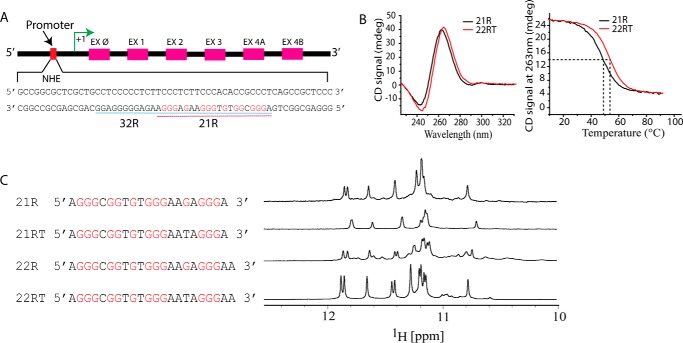
Figure 1.
A, representation of human KRAS gene showing sequences of the NHE (13) and 32R and 21R(46). EX, exon. B, CD spectra of 21R and 22RT KRAS sequences at 5 μm (left) and CD melting profiles at 3 μm. C, sequences of KRAS NHE fragments (left) and corresponding imino region 1D NMR spectra obtained at 1 mm strand concentration at 20 °C in a pH 6.5 buffer containing 20 mm potassium phosphate supplemented with 70 mm KCl. mdeg, millidegrees.

