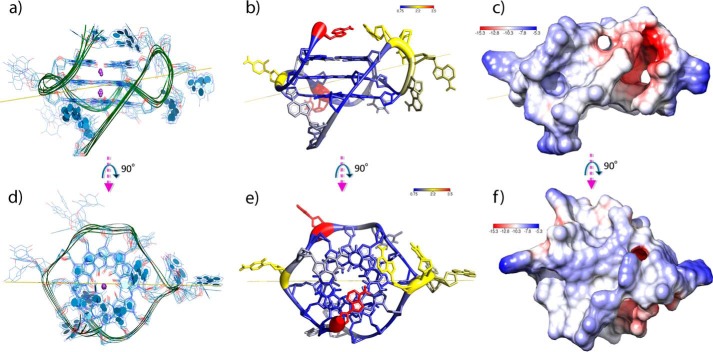
Figure 3.
a, depiction of the ensemble of the six lowest-total-energy refined structures of 22RT. All guanines are in the anti conformation. K+ counterions are depicted in purple, and the yellow line represents the principal axis of the six averaged all-atom mass-weighting principal inertial axes. On average, each conformer structure principal axis spans nearly 26 × 44 Å. The average groove width is 12 ± 2 Å. In the depiction on the right, the 5′- and 3′-ends of the oligonucleotide are at the top and bottom of the image, respectively. b, the average structure calculated from the six lowest-total-energy conformers. The ribbon thickness is proportional to the all-atom r.m.s.d. numerically represented by the color (see key for code in Å). A1 and T8 in red have the largest r.m.s.d. values (≈3.5 Å) of all residues. c, electrostatic surface of 22RT calculated using the Adaptive Poisson-Boltzmann Solver (APBS). The map was calculated using multiple Debye-Hückel boundary conditions and a nonlinear Poisson-Boltzmann equation with 40 points as the surface density at 293 K. The scale is reported in dimensionless units. The electronegative tunnel/cavity (red) represents a unique feature not usually found in canonical nucleic acid structures. In the bottom panels (d–f), the structure has been rotated (90°) so that the view is down onto the G-quartet plane that contains the 5′-most G.

