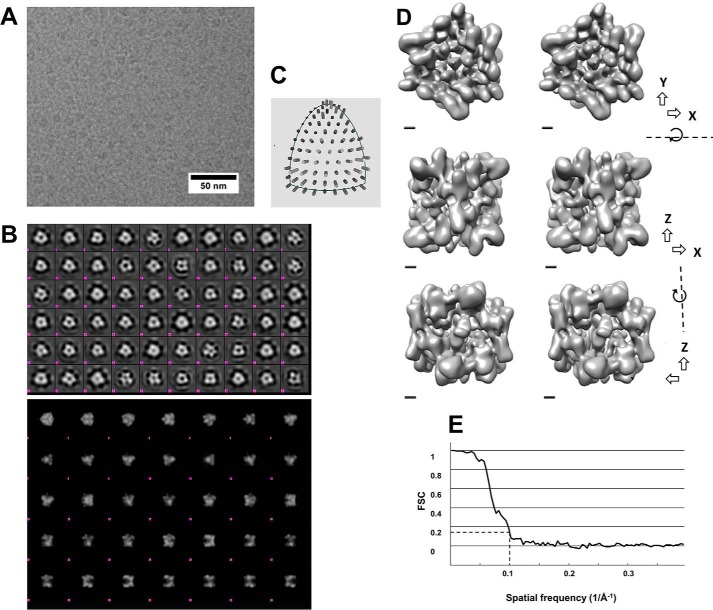
Figure 2.
Cryo-EM of Hsp21 to generate a density map at 10 Å resolution. A, cryo-electron microscopy image of Hsp21 oligomers. The sample was plunge-frozen in liquid ethane and imaged in a JEOL JEM2100F electron microscope. Frame sets covering 2-s exposures were recorded on a DE-20 direct electron detector. The images were drift-corrected by aligning the acquired frames. B, top, class averages from a 2D classification of boxed out regions containing Hsp21 particles. There are several averages with approximate 3-fold and 2-fold symmetry (e.g. 3-fold: row 5 column 9, row 2 column 3; 2-fold: row 2 column 5). The classification was performed using Relion. The size of each box is ∼24 nm. Bottom, reprojections of the final 3D reconstruction with D3 symmetry low-pass filtered to 30 Å resolution. Several projections are similar to class averages in the top panel; for example, the side views in row 5 can be recognized in class averages with approximate mirror symmetry in the top panel (e.g. row 6 column 7). C, distribution of angles according to EMAN2. D, 3D map of the Hsp21 oligomer. Surface-rendered views at contour level 4.5σ are illustrated in a cross-eye stereo representation using Chimera. The views are along the 3-fold axis (top), 2-fold axis from one side (middle), and 2-fold axis from the other side (bottom). Scale bar, 10 Å. E, Fourier shell correlation curve between reconstructions produced by splitting the data set into two halves. Both halves were reconstructed separately. The resolution of the final 3D map was calculated to 10.0 Å from the curve at FSC = 0.143.

