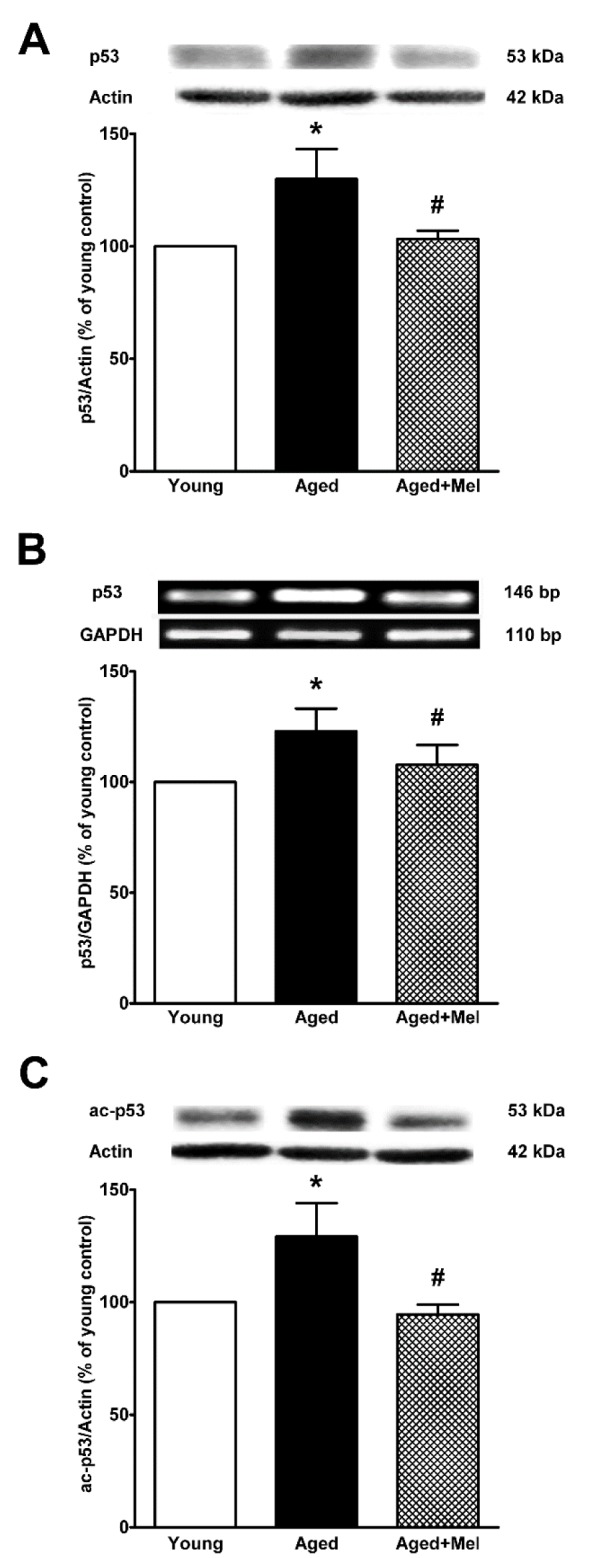
Figure 3. The effect of melatonin on p53 protein expression (A), p53 mRNA expression (B) and the acetylated form of p53 protein expression (C) in the aging mouse hippocampus. Aged mice were treated with drinking water or melatonin (Mel) at 10 mg/kg/day for 6 months. Representative bands from the different groups are shown. The bands from the semi-quantitative PCR were normalized to Gapdh, whereas the band densities from the Western blots were normalized to actin. The ratios were calculated as a percentage of the respective value of the control group. The values represent means ± SEM (n=4 for each group (* denotes a significant difference with p < 0.05 compared with the young control group, and # denotes a significant difference with p < 0.05 compared with the aged control group).

