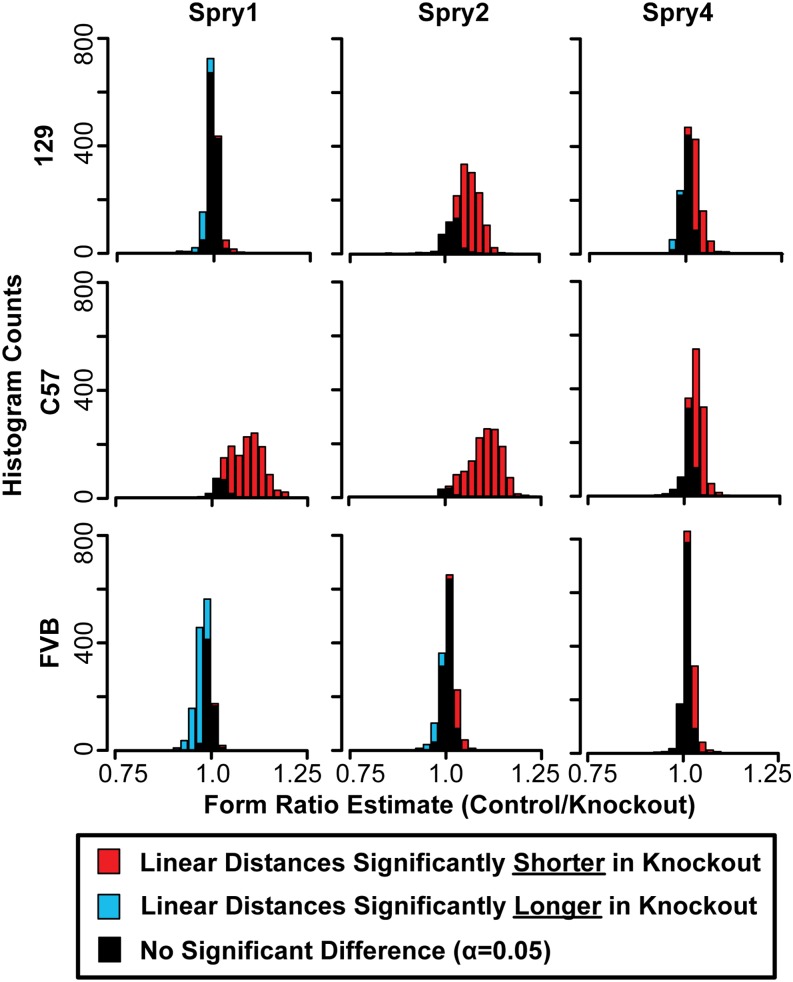
Figure 2.
Form ratio histograms. Histograms of the ratios of all linear distances between our landmarks, where the mean linear distance value of the control mice (+/+) is the numerator and the mean linear distance value of the homozygous null mice (−/−) is the denominator. The proportion of linear distance ratios that are significantly different to one at α = 0.05, based on bootstrapping the control group, are indicated by colors in the histogram bars. Ratio estimates >1 indicate that the linear distance is shorter in −/− mice than in +/+ mice (red), while estimates <1 indicate that the linear distance is longer in −/− mice than in +/+ mice (blue).

