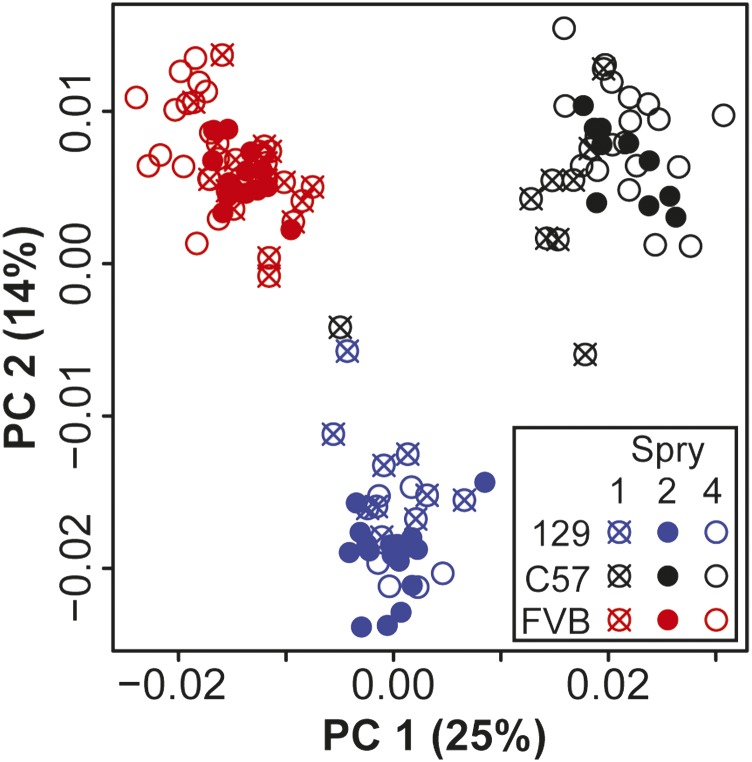
Figure 3.
Control shape PCA. Principal component (PC) 1 and PC2 from a PCA of control (+/+) specimen landmark coordinates after Procrustes superimposition (including scaling of landmark configurations), but without any allometric regression or background correction. The C57 specimen that plots close to 129 control specimens does not represent a plotting or background identification error. PCA, principal component analysis; %, % of variance.

