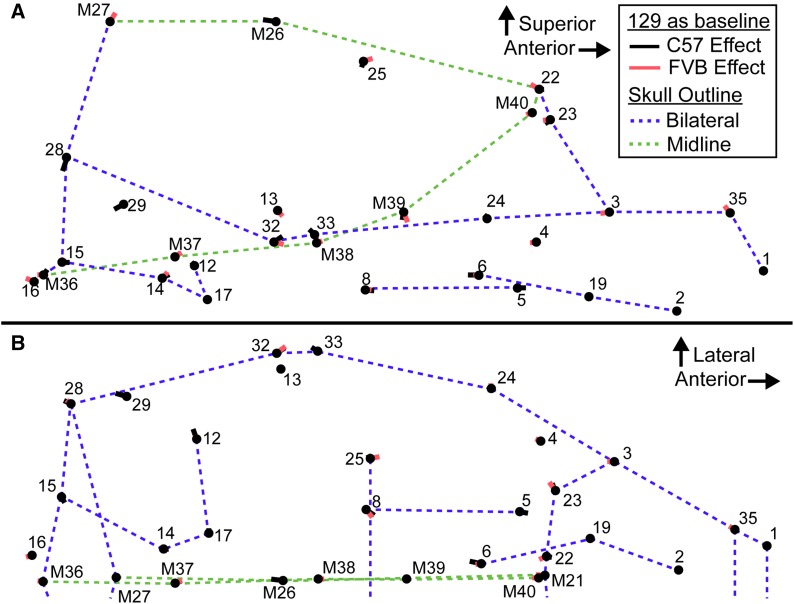
Figure 4.
Background control shape difference vectors. Vectors illustrating the difference in mean shape between the three backgrounds from the (A) lateral and (B) superior views (only midline and left side landmarks shown). In both cases, the nose of the mouse is to the right. 129 is used as a baseline for comparison, the black vectors go from 129 mean shape to C57 mean shape (vector length is scaled 1:1 with landmark coordinates), the red vectors go from 129 mean shape to FVB mean shape. Thin skull outlines are references for sagittal midline features (green) and bilateral features (blue), which are meant to provide a frame of reference within the skull. Landmark numbers match a previously defined landmark list (Percival et al. 2016) and midline landmarks are highlighted with a preceding “M.” This is not a representation of the covariation associated with a principal component, but is the actual vector of difference in mean Procrustes coordinates between these groups.

