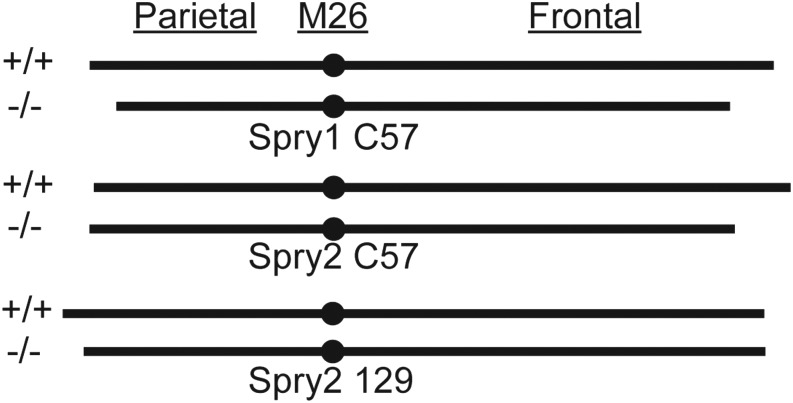
Figure 7.
Mean vault bone length comparisons. A simplified illustration of the relative contribution of the frontal bone and the parietal bone to total vault length (see also Table 6) for controls and homozygote knockouts of Spry1 on the C57 background (top), Spry2 on C57 (middle), and Spry2 on 129 (bottom). All illustrated bone lengths are to scale.

