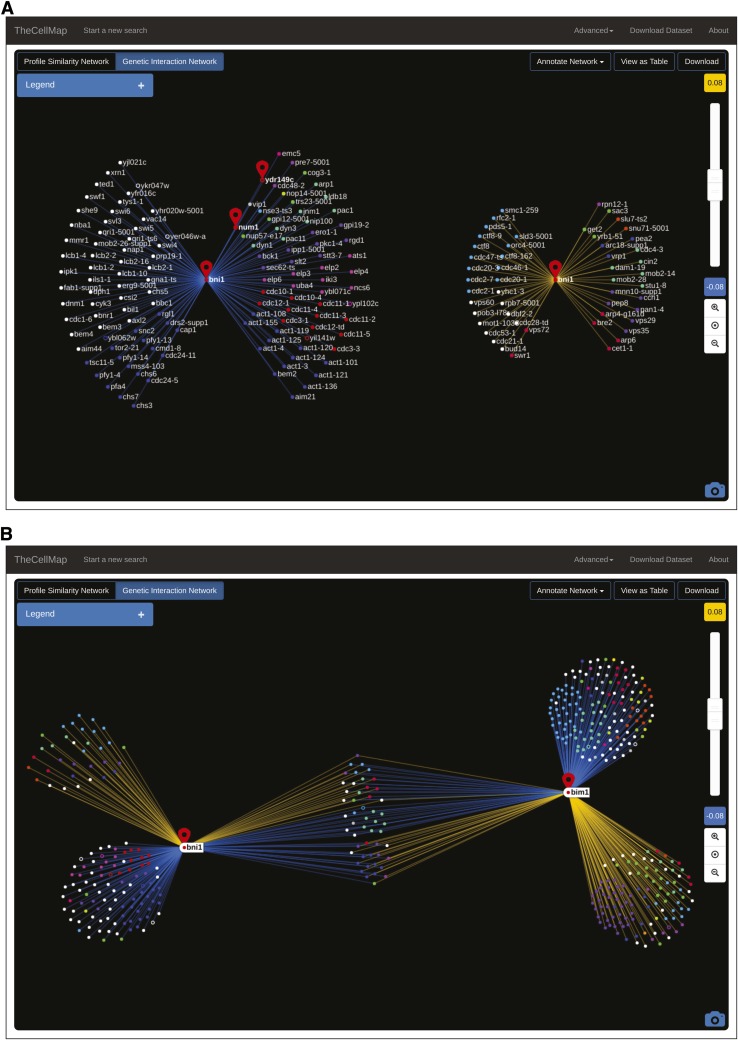
Figure 7.
Negative and positive genetic interaction subnetworks. (A) A genetic interaction network illustrating negative (blue) and positive (yellow) genetic interactions for BNI1. NUM1 and YDR149C are also indicated. Nodes are colored based on the SAFE annotation standard. Open circles represent dubious ORFs. (B) A BNI1 and BIM1 genetic interaction network. Negative and positive interactions are depicted as in (A). Nodes are colored based on the SAFE annotation standard. Open circles represent dubious ORFs. ORF, open reading frame; SAFE, Spatial Analysis of Functional Enrichment.

