Figure 1.
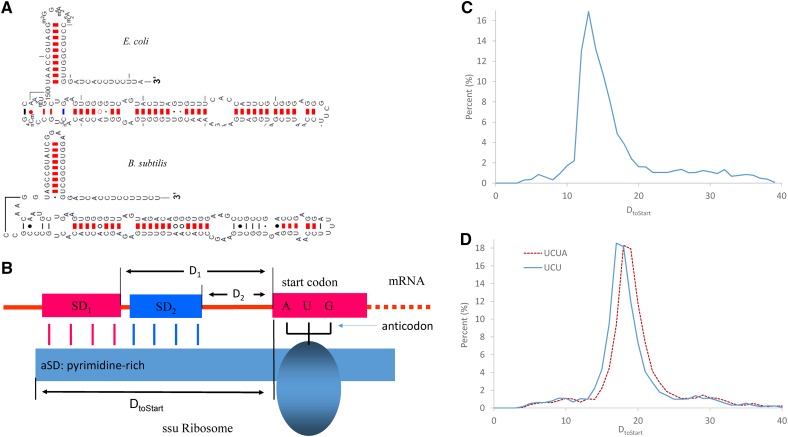
A model of SD sequence and aSD interactions. (A) The free 3′ end of SSU rRNA (3′TAIL) of E. coli and B. subtilis based on the predicted secondary structure of the 3′ end of the ssu rRNA of E. coli and B. subtilis from mfold 3.1, adapted from the comparative RNA web site and project (http://www.rna.icmb.utexas.edu). (B) A schematic representation of SD and aSD interaction illustrates DtoStart as a better measure for quantifying the optimal positioning of SD and aSD than the conventional distance from putative SD to start codon. SD1 or SD2, as illustrated, are equally good in positioning the start codon AUG against the anticodon of the initiation tRNA, but they differ in their distances to the start codon. DtoStart is the same for the two SDs. (C, D) DtoStart is constrained to a narrow range in E. coli (C) and B. subtilis (D); solid blue line denotes SD hits with the UCU-ending TAIL, and the dashed red line shows SD hits with the UCUA-ending TAIL. The y-axis in (C) and (D) represents the percentage of SD motif hits detected. See Materials and Methods section for details.

