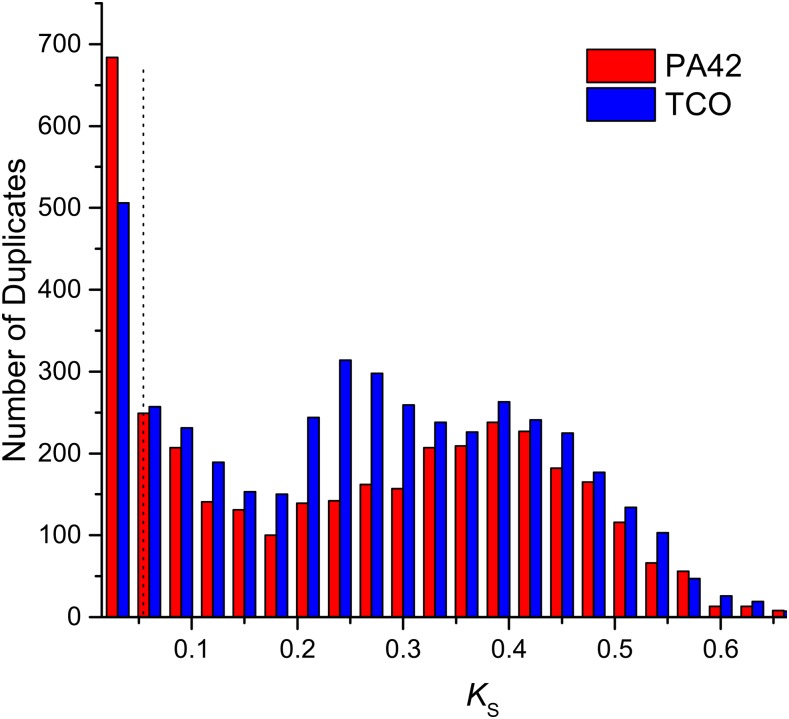
Figure 3.
The frequency distribution of KS for paralogs within the PA42 genome vs. those within TCO. Only genes in orthologous clusters containing both TCO and PA42 genes were used. Sliding-window analyses were used to remove the low quality regions in the alignments, with a cutoff of 0.4 identity for each 15-bp window. The KS value for each paralog is the average value when comparing the paralog with others in an orthologous cluster of the genome. The vertical dashed line at 0.057 denotes the average silent-site divergence for pairs of TCO-PA42 orthologs, so that paralogous pairs to the left of this benchmark are younger than the average ortholog divergence between these two clones. KS, pairwise divergence at silent sites.

