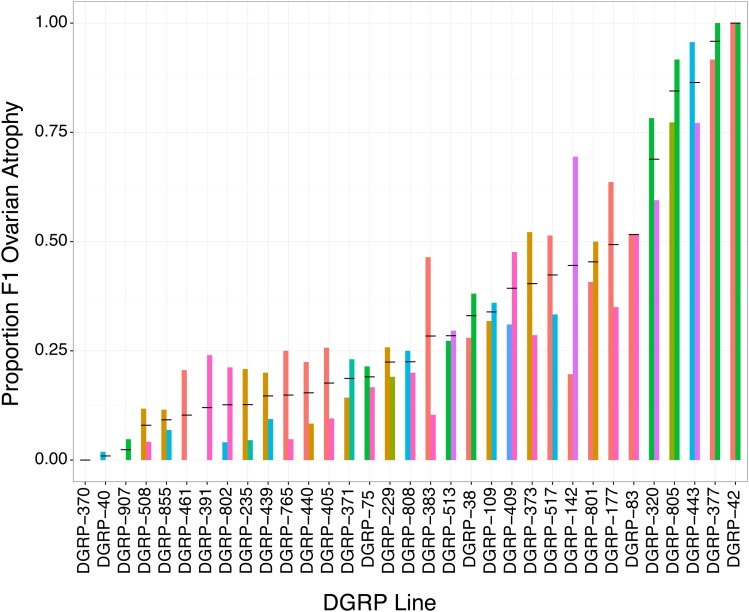
Figure 1.
Variation paternal in induction of hybrid of dysgenesis among DGRP lines. Thirty-three DGRP lines are indicated on the x-axis. The y-axis indicates the proportion of F1 offspring that exhibited ovarian atrophy in crosses between the DGRP males and Canton-S females. Bars are colored according to experimental block. Lines are sorted according to the average proportion of F1 females exhibiting atrophied ovaries across both experimental blocks, which is indicated by the back horizontal bar. DGRP, Drosophila Genetic Reference Panel.

