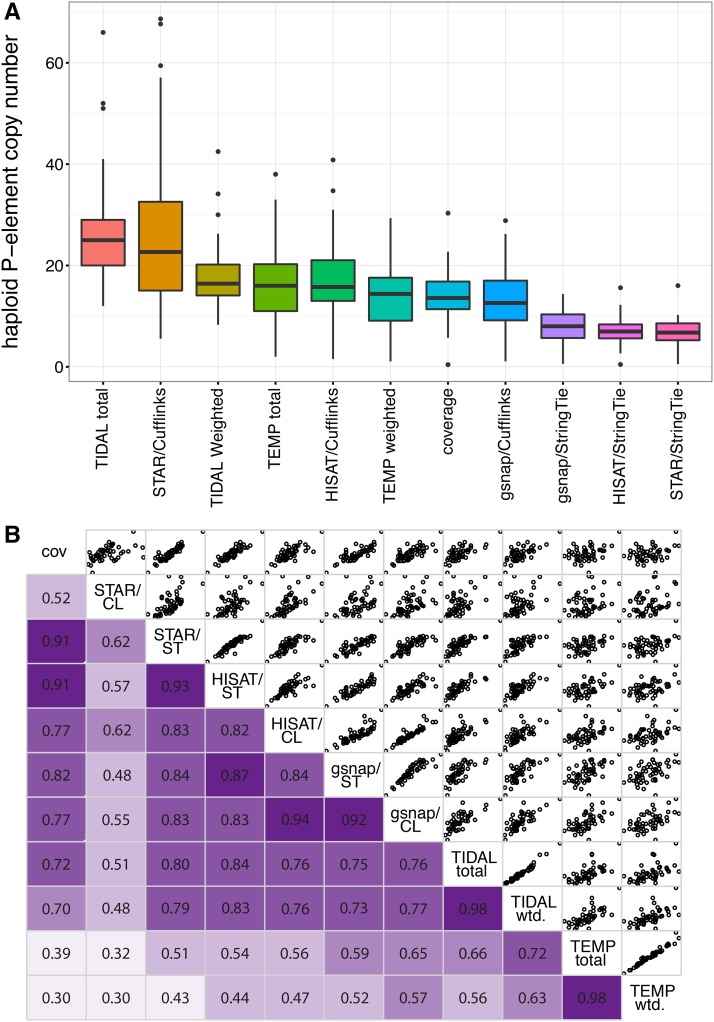
Figure 2 .
P-element abundance varies among DGRP genomes. (A) Distribution of haploid copy numbers among 52 genomes is shown for 11 different estimators of P-element abundance. (B) Correlation matrix of haploid copy numbers from each of the 11 estimators. In the lower panels, Pearson’s R correlation values are given, with darker shades of purple indicating stronger correlations. The upper panel provides scatter plots comparing pairs of estimators. CL, Cufflinks; cov, normalized coverage; DGRP, Drosophila Genetic Reference Panel; ST, StringTie; wtd., weighted.

