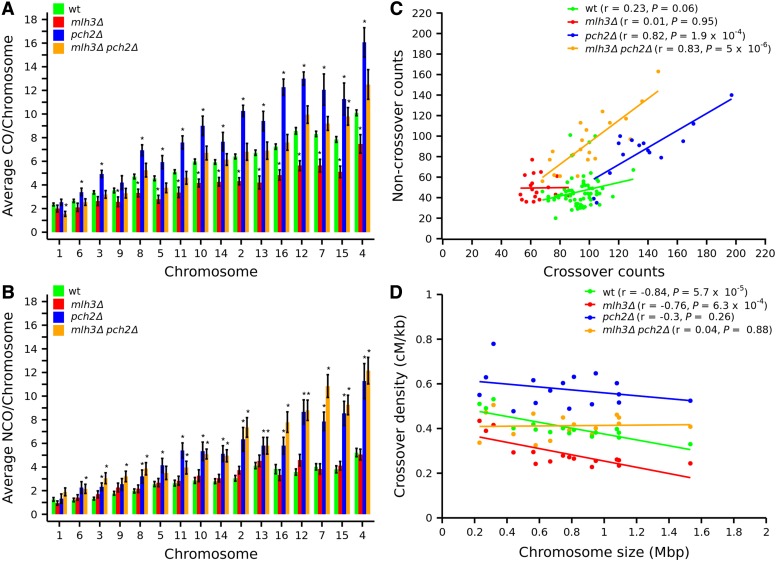
Figure 2.
Crossover and noncrossover distribution on chromosomes for wild type, mlh3Δ, pch2Δ, and mlh3Δ pch2Δ. (A, B) Bar plot showing average crossover and noncrossover counts per chromosome for wild type, mlh3Δ, pch2Δ, and mlh3Δ pch2Δ. The asterisk symbol (*) shows chromosomes with significant difference (P < 0.05, t-test) in crossover or noncrossover counts compared to wild type. Chromosomes are arranged according to size from left to right. Error bars are “mean ± SE.” (C) Crossover vs. noncrossover scatter plot with correlation coefficient (r) and P values for wild type, mlh3Δ, pch2Δ, and mlh3Δ pch2Δ. (D) Crossover density (centimorgans per kilobase) plotted as a function of chromosome length (megabase) for wild type, mlh3Δ, pch2Δ, and mlh3Δ pch2Δ along with the correlation coefficient (r) and P values.

