Figure 6.
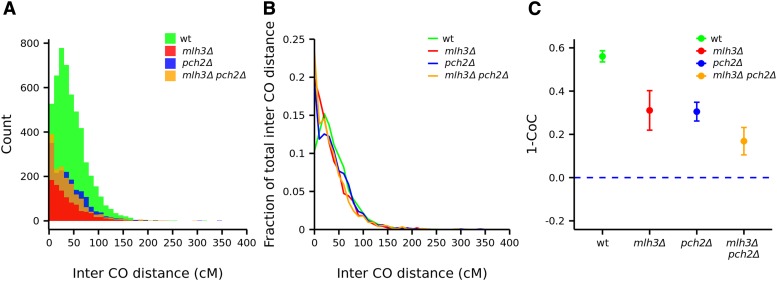
Analysis of crossover interference in wild type, mlh3Δ, pch2Δ, and mlh3Δ pch2Δ. (A) Histogram showing actual count of intercrossover distances. (B) Line plot showing intercrossover distances as a fraction of the total for wild type, mlh3Δ, pch2Δ, and mlh3Δ pch2Δ. (C) Interference (1–CoC) in wild type (0.56), mlh3Δ (0.31), pch2Δ (0.30), and mlh3Δ pch2Δ (0.17) plotted for 0–25 kb adjacent intervals.

