Figure 2.
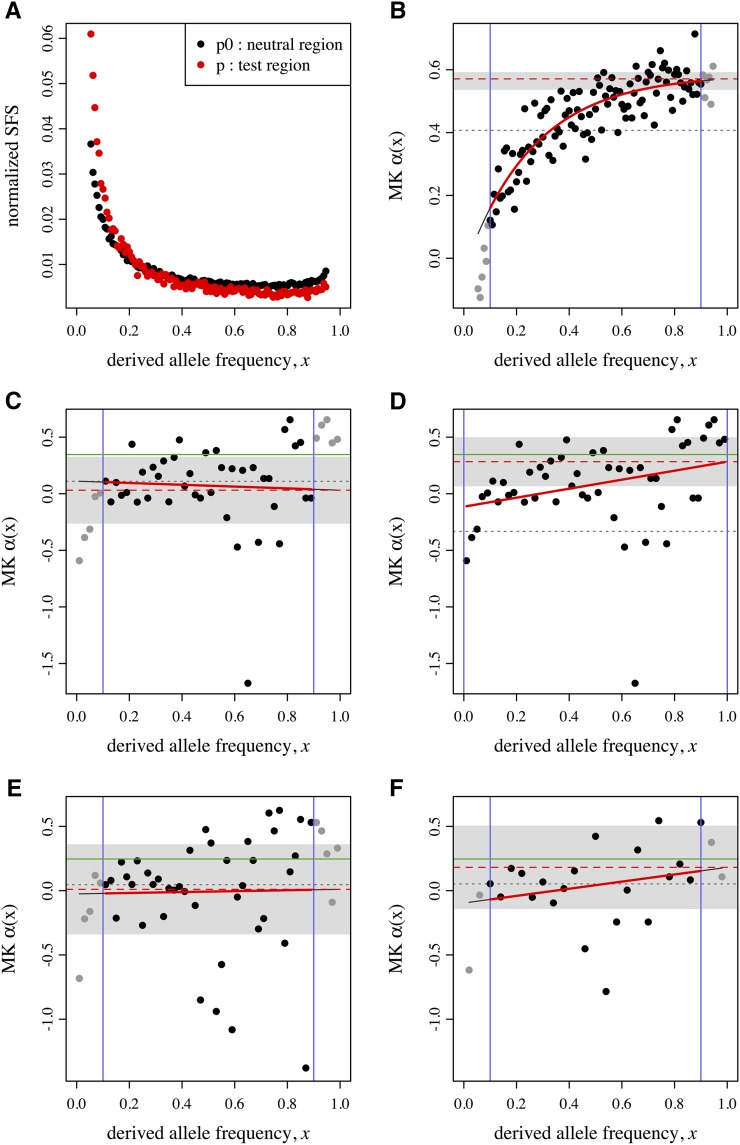
Results from asymptoticMK for three test data sets. (A) Normalized site frequency spectrum (SFS) for the Drosophila data set used in Messer and Petrov (2013). Points show normalized binned polymorphism frequencies for the neutral region (black) and the test region (red). (B) Result of asymptoticMK’s analysis of that data set. The two vertical blue lines show the limits of the frequency cutoff interval used for fitting. Points indicate binned values of α(x), estimated according to Equation 2; points are gray if they are outside the cutoff interval (and thus not used in fitting). The solid red curve shows the fitted αfit(x) (here, exponential). The dashed red line shows the estimate of αasymptotic, obtained from the fitted function according to Equation 3. The gray band indicates the 95% C.I. around this αasymptotic estimate. The dotted gray line shows the estimate of αoriginal, obtained from the original (nonasymptotic) McDonald–Kreitman (MK) test, for comparison (also calculated using only the data within the cutoff interval). (C) and (D) show corresponding results from one SLiM simulation run, and (E) and (F) show results from another SLiM simulation run; in each case, the first panel shows the result of an automated fit using asymptoticMK, whereas the second shows the improvement after hand tailoring of the fit (see Results and Discussion). Note that in all four cases, the linear fit was deemed more appropriate by asymptoticMK. The solid green horizontal lines, finally, show the true value of α in the simulation runs for comparison.

