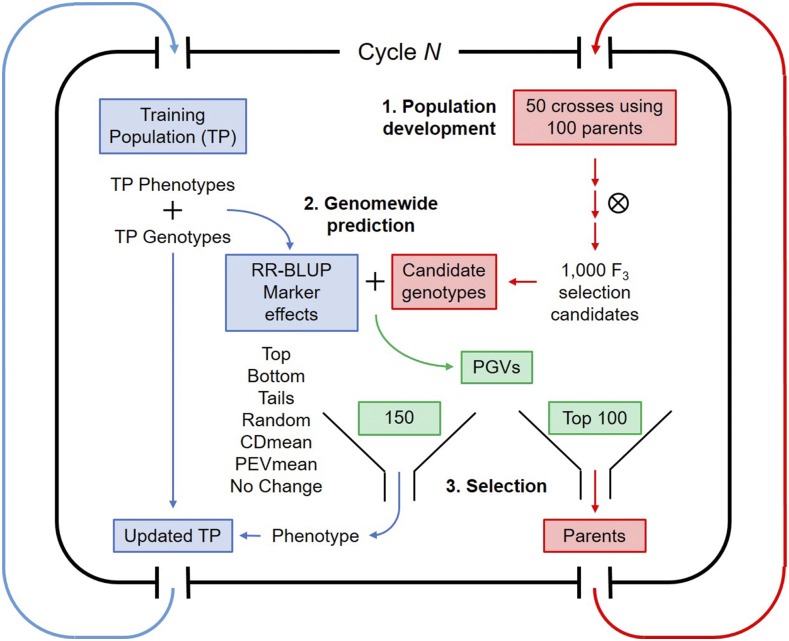
Figure 2.
A single breeding cycle in our simulations may be broken down into two main streams. Blue indicates steps involving the training population and red indicates steps involving crossing and population development. Green indicates the intermediate step of selection. (1) Fifty crosses are made using 100 randomly intermated parents from the previous cycle. Population development follows and 1000 selection candidates are genotyped at the F3 stage. Concurrently, marker effects are estimated using genotypic and phenotypic data from the training population (TP). (2) The predicted genotypic values (PGVs) of the selection candidates are used in decision-making. (3) The 100 selection candidates with the highest predicted genotypic values are selected as parents for the next cycle. Additionally, 150 selection candidates are selected based on the six different update methods. These candidates are phenotyped, and phenotypic and genotypic data are added to the pool of training data.

