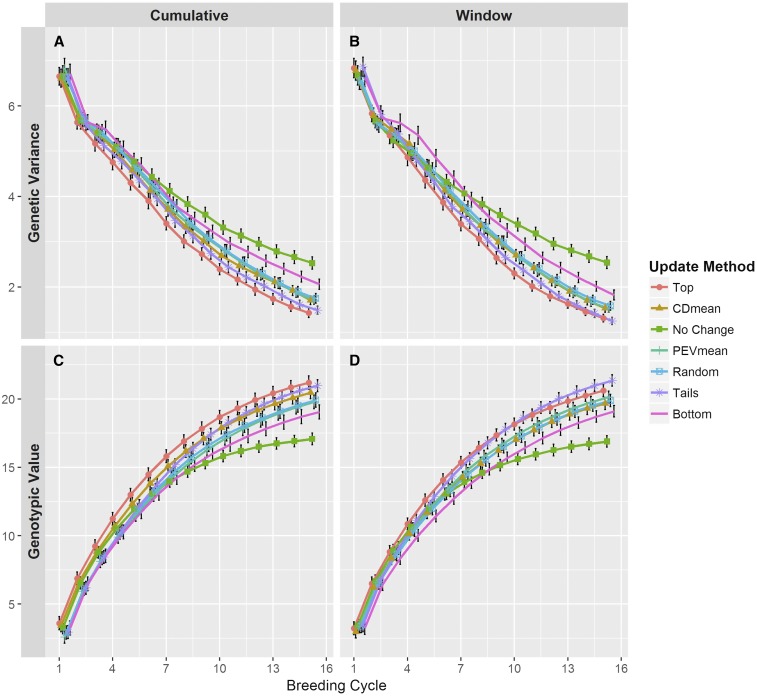
Figure 4.
Genetic variance (A and B) and genotypic values (C and D) among the selection candidates over breeding cycles of the simulation. Line colors and point shapes delineate the different methods of updating the training population. Plots are separated into the (A and C) Cumulative and (B and D) Window updating scenarios. Average values are shown with 95% confidence intervals. To help reduce plot clutter, points for each update method are given a small, consistent jitter along the x-axis.

