
Fig. 2.
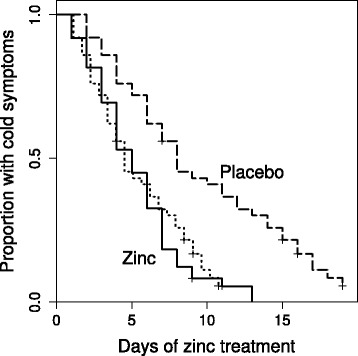
Survival curves for the treatment groups and for the 43% shortened placebo group cold durations for the Mossad [9] study. The solid curve indicates the zinc lozenge group, the dashed curve on the right hand side indicates the placebo group, and the dotted curve overlapping the zinc lozenge curve indicates the recovery curve obtained by shortening all the placebo group common cold durations by 43%. The difference between the placebo group and the zinc lozenge group is significant, P = 10−5 on the logrank test, whereas there is no difference between the zinc lozenge group and the 43% shortened placebo group common cold durations (P = 0.8). The 4.0-day shortened placebo group colds (2nd row in Fig. 1) would lead to a survival curve starting to decline before day 0 and crossing the zinc group curve. To keep this figure less confusing that curve is not shown. Cox regression model indicates that zinc lozenges increased the rate of recovery by RR = 2.7 (95% CI 1.7 to 4.4)