
Fig. 3.
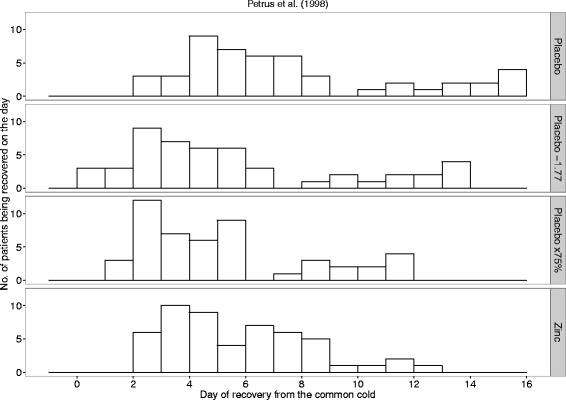
The observed days of recovery and the transformed placebo group days of recovery in the Petrus [10] study. The first row shows the observed number of placebo patients who recovered on the day shown on the horizontal axis. The bottom row shows the observed number of zinc lozenge patients who recovered on the given day. The SDs of the placebo and zinc lozenge groups are significantly different with P = 0.004. The second row shows the transformation in which each placebo group common cold is assumed to become 1.77 days shorter because of the effect of the zinc lozenges. The third row shows the transformation in which each placebo group common cold is assumed to become 25% shorter because of the zinc lozenges