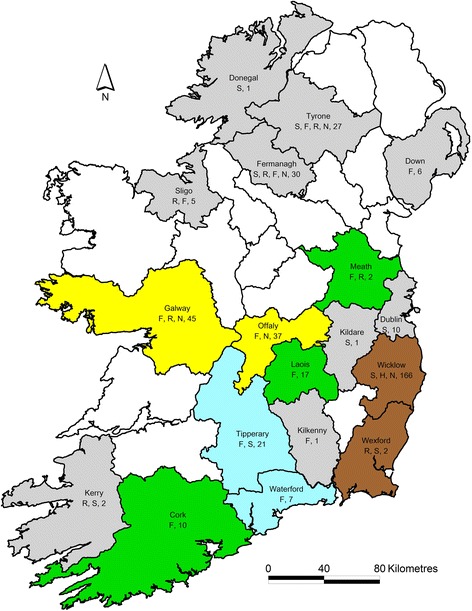
Fig. 1.

Map showing counties from which deer were submitted, including species and total number sampled in each county (F, fallow; H, Hybrid; R, Red; S, Sika; N, not recorded). Counties in which one or more positive results were recorded for SBV only, for BoHV-1 only, for both BoHV-1 and BVD and for BoHV-1, BVD and SBV are coloured green, blue and brown, respectively; results for the remaining counties from which samples were submitted (coloured grey) were negative for all four pathogens
