
Fig. 2.
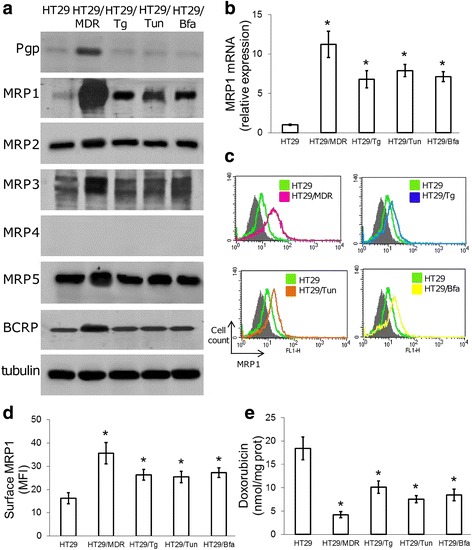
Expression of MRP1 in cells resistant to chemotherapy and to ER stress. a. Immunoblots of the indicated proteins in extracts of untreated cells. β-tubulin was used as a loading control. The figure is representative of 3 experiments with similar results. b. MRP1 mRNA level as measured by qRT-PCR. Data are mean ± SD (n = 4). *p < 0.001 vs. HT29 cells. c. Representative flow cytometry histograms of MRP1 protein. Grey peaks: non immune isotypic antibody. d. Cell surface MRP1 was determined by flow cytometry. Data are mean fluorescence intensity (MFI) ± SD (n = 3). *p < 0.02 vs. HT29 cells. e. Intracellular doxorubicin content, an index of MRP1 activity, measured by fluorimetry. Data are mean ± SD (n = 3). *p < 0.001 vs. HT29 cells