
Fig. 3.
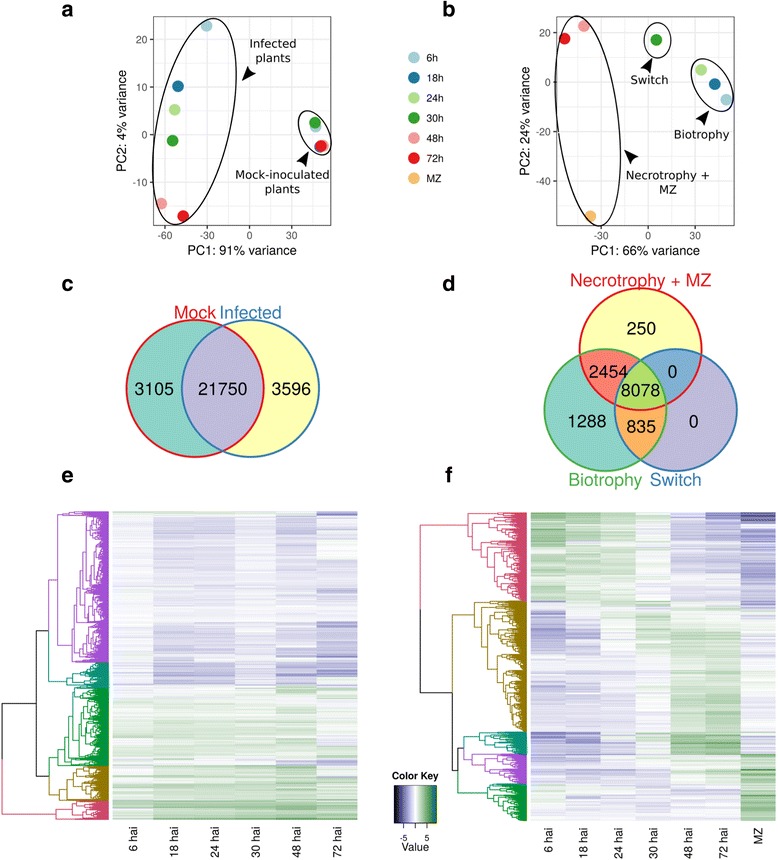
N. benthamiana and P. palmivora transcriptomes show different temporal dynamics during interaction. a, b PCA clustering of full transcriptional profiles of N. benthamiana (a) and P. palmivora (b). c, d Venn diagrams show shared genes expressed in groups identified by PCA analysis for N. benthamiana (c) and P. palmivora (d). Genes with transcripts per million (TPM) ≥5 were considered to be expressed. e, f Hierarchical clustering of major classes of differentially expressed genes (p value < 10-3, log fold change (LFC) ≥ 2) in N. benthamiana (e) and P. palmivora (f) transcriptomes. Relative expression levels of each transcript (rows) in each sample (column) are shown. TPMs were log2-transformed and then median-centred by transcript. Plant samples were centred according to the full set of mock and infected samples; only infected samples are shown. MZ axenically grown mycelium with sporangia