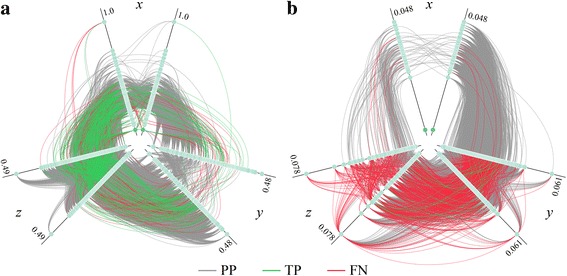
Fig. 6.

Hive plots of PPI networks for the proteome of E. coli. Turquoise circles (nodes) represent individual proteins connected by interactions (edges). Three types of interactions are denoted by edges in different colors, positive predictions are gray, true positives (predicted interactions also present in the DIP database) are green, and false negatives (DIP interactions that are not predicted) are red. a Network constructed by modeling the structures of hetero-dimer complexes followed by the classification of interfaces with machine learning. b Random network comprising the same number of nodes and edges as the structure-based network, however, with interactions randomly assigned to pairs of nodes. E. coli proteins are assigned to three axes based on their degree d, low-degree (d <50) on the x-axis, medium-degree (50 ≤ d ≤80) on the y-axis, and high-degree (d >80) on the z-axis. Each axis is then split into two identical axes in order to show interactions within each group. Further, nodes on the axes are sorted by the increasing clustering coefficient c with the maximum value of c shown next to each axis (note the significant scale difference between a and b)
