
Fig. 1.
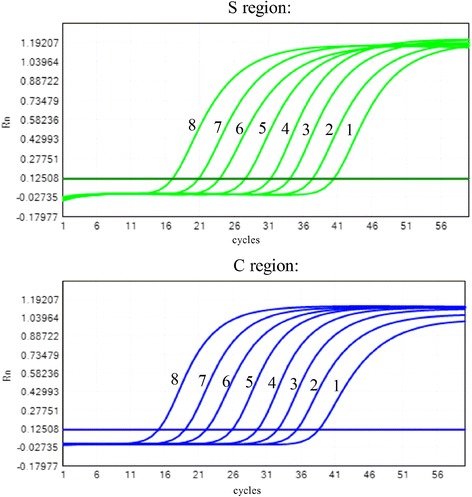
The amplification curves for the S and C regions using the duplex real-time PCR assay with diluted high-titer HBV samples (from 2.0 × 10⁸ to 2.0 × 101 IU/ml)
Official websites use .gov
A
.gov website belongs to an official
government organization in the United States.
Secure .gov websites use HTTPS
A lock (
) or https:// means you've safely
connected to the .gov website. Share sensitive
information only on official, secure websites.
The amplification curves for the S and C regions using the duplex real-time PCR assay with diluted high-titer HBV samples (from 2.0 × 10⁸ to 2.0 × 101 IU/ml)