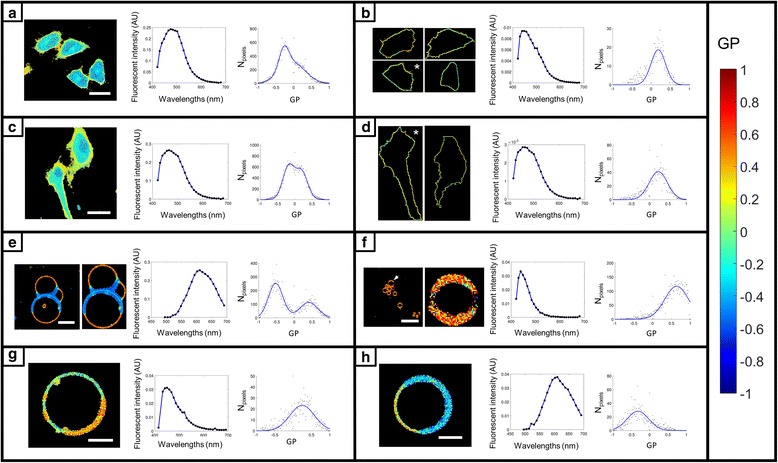
Fig. 2.

Segmentation and spectral analysis with the Spectral Imaging Toolbox. Each panel contains from left to right: a pseudo-colored GP map, the spectra calculated from all pixels of the spectral image stack with significant signal values, and a histogram of GP values fitted with either a single or double peak Gaussian. a A-549 cells stained with C-Laurdan, labeling both the plasma membrane and the cytosol. Scale bar 27 μm. b The same cells from (a) but now surface-segmented for plasma membrane only using the watershed method. c A-549 cells stained with C-Laurdan, labeling both the plasma membrane and the cytosol. Scale bar 33 μm. d The same cells from (c) but now surface-segmented for plasma membrane only using lasso-segmentation. In (b) and (d) the GP histograms and spectra are for the images indicated with an asterisk. e GUVs composed of DOPC, brain SM, and cholesterol (2:2:1 molar ratio) labelled with FE (Di-4-AN(F)EPPTEA). Unsegmented (far left), cropped and isolated GUVs in the adjacent image. Scale bar 17 μm. f GP image of C-Laurdan-labelled microbubbles (far left) was auto-segmented using the spherical object mode of the Spectral Imaging Toolbox. Scale bar 13 μm. One of the microbubbles, indicated by the arrow in the far left image, is shown post-segmentation in the adjacent image. Due to few pixels in the segmented microbubble, the GP distribution is shown for the unsegmented image. g GPMV labelled with Laurdan. Scale bar 5 μm. h GPMV labelled with Di-4-ANEPPDHQ. Scale bar 5 μm. Color bar legend gives GP values and is valid for all images
