Fig. 4.

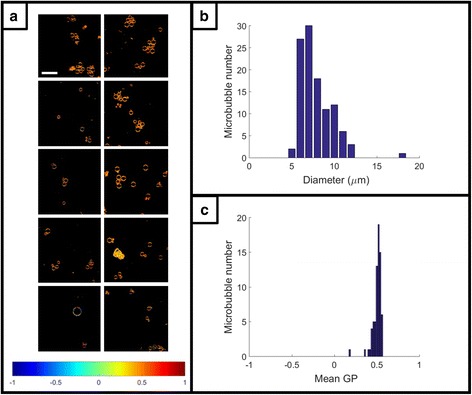
Spectral analysis and size distribution of microbubbles. a Pseudo-colored GP images from 10 spectral image stacks of microbubbles labelled with C-Laurdan. Microbubbles were auto-segmented and analyzed using the spherical object mode of the Spectral Imaging Toolbox. Scale bar 30 μm. Color bar legend gives GP values. b Size distribution (diameter) of the segmented microbubbles (n = 71). c Distribution of mean GP values for the segmented microbubbles (n = 71)
