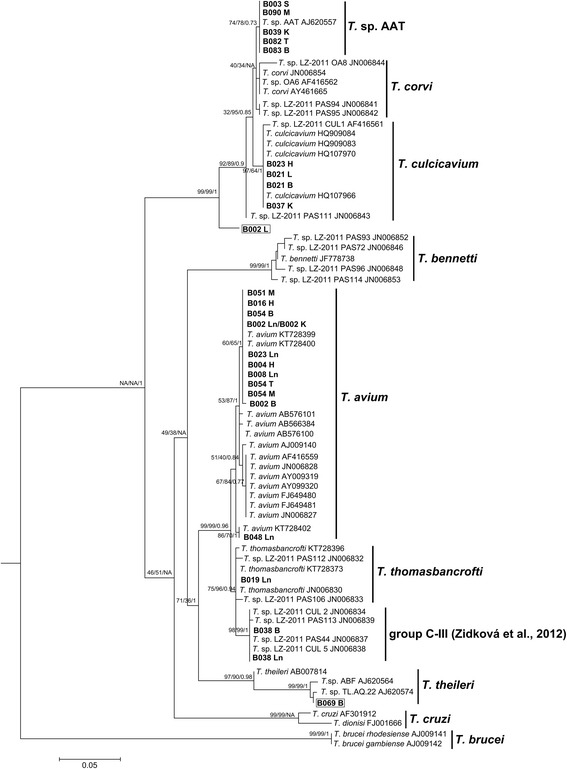
Fig. 1.

Phylogenetic analysis of avian Trypanosoma spp. based on partial ribosomal subunit (18S rDNA) sequences. This tree was generated using maximum likelihood with a GTR + G + I DNA substitution model. Numbers adjacent to isolate names indicate GenBank accession numbers and sequences acquired in this study are in bold, which represent the bird identification code. The samples in boxes were novel isolates. The first two numbers at the nodes indicate bootstrap support for 1000 searches for maximum-likelihood and neighbour-joining, respectively. The final number indicates Bayesian posterior probability. Trypanosoma brucei rhodesiense and Trypanosoma brucei gambiense are used as outgroups. Scale-bar indicates substitution per site
