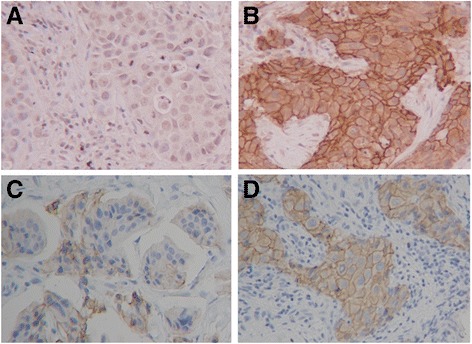
Fig. 1.

Immunohistochemical determination of plakoglobin and E-cadherin. Plakoglobin and E-cadherin were observed at cell–cell boundaries of breast cancer cells. Plakoglobin expression was categorised as follows: 0 = no cells; 1+ = 1–25% of cells (a); 2+ = 26–75% of cells; 3+ = >75% of cells (b). E-cadherin expression was categorised as follows: 0 = no cells; 1+ = 1–30% of cells (c); 2+ = 31–70% of cells; 3+ = >70% of cells (d) (400×)
