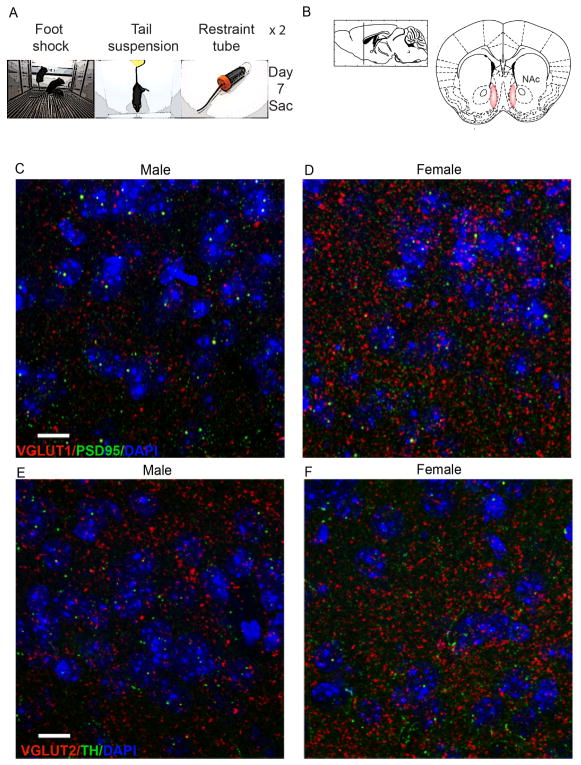
Fig. 1. VGLUT expression and colocalization with synaptic labels.
(a) Schematic of time line of study. (b) NAc coordinates. (c–d)VGLUT1 (red) and PSD95 (green) puncta in NAc of male and female control mice. (e–f) VGLUT2 puncta (red) and TH puncta and fibers (green) in NAc of male and female control mice. 100×, scale bar 10 μm.

