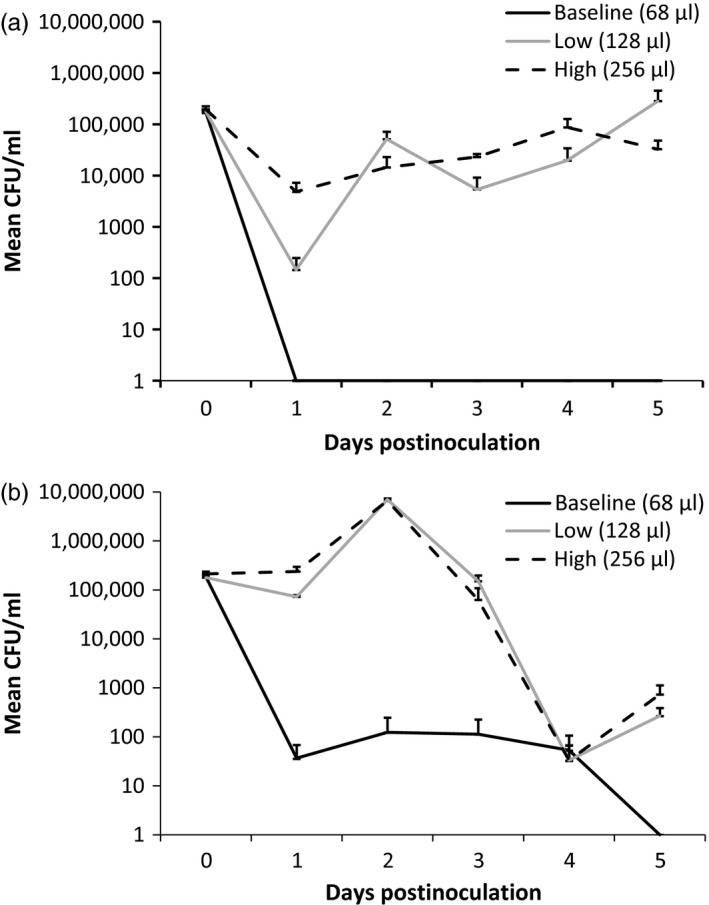
Figure 2.

Bacterial densities (mean ± SEM) as colony‐forming units per milliliter of a high‐virulence strain B067 (a) and a low‐virulence strain B398 (b) of Flavobacterium columnare at different levels of nutrient enrichment in sterile tap water. The volumes of nutrient medium at each nutrient level (baseline, low, and high) are expressed in the legend. Note the logarithmic scale on y‐axis
