. 2017 Jan 19;8(4):2832–2840. doi: 10.1039/c6sc04633a

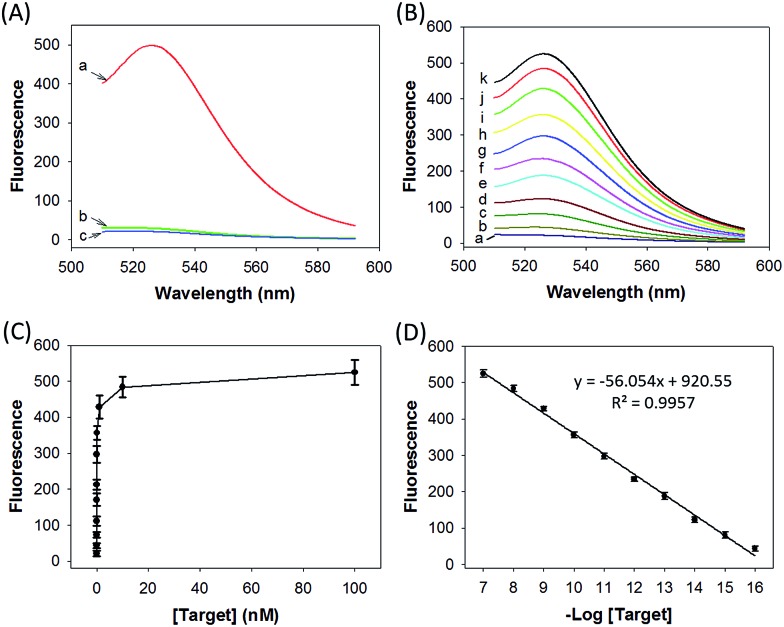
Fig. 2. (A) Fluorescence spectra obtained by incubating the nanosystem carrying H0, H1, H2 and H3 with the (a) target sequence, (b) nontarget sequence, and (c) assay buffer as well as the target sequence. (B) Fluorescence spectral responses to the target sequence with different concentrations: (a) 0 M, (b) 1 × 10–16 M, (c) 1 × 10–15 M, (d) 1 × 10–14 M, (e) 1 × 10–13 M, (f) 1 × 10–12 M, (g) 1 × 10–11 M, (h) 1 × 10⁻¹⁰ M, (i) 1 × 10⁻⁹ M, (j) 1 × 10⁻⁸ M, and (k) 1 × 10⁻⁷ M target sequence. (C) Plot of fluorescence peak intensities (at 526 nm) versus target concentrations. (D) Fluorescence peak intensities versus target concentrations on a logarithmic scale.

Fig. 2