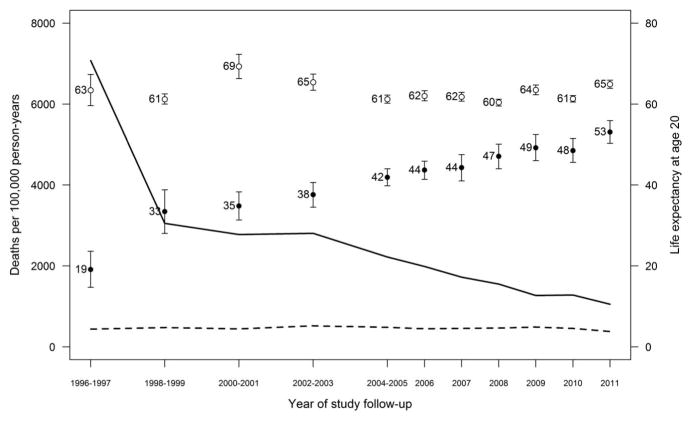
FIGURE 1.
Age-adjusted mortality rates and life expectancy at age 20 for HIV-infected and HIV-uninfected individuals, Kaiser Permanente California, 1996–2011. Rates are represented by solid lines for HIV-infected and dotted lines for HIV-uninfected individuals (P < 0.001 and P = 0.43 for changes over time, respectively). Life expectancies at age 20 are represented by solid circles for HIV-infected and open circles for HIV-uninfected individuals.

