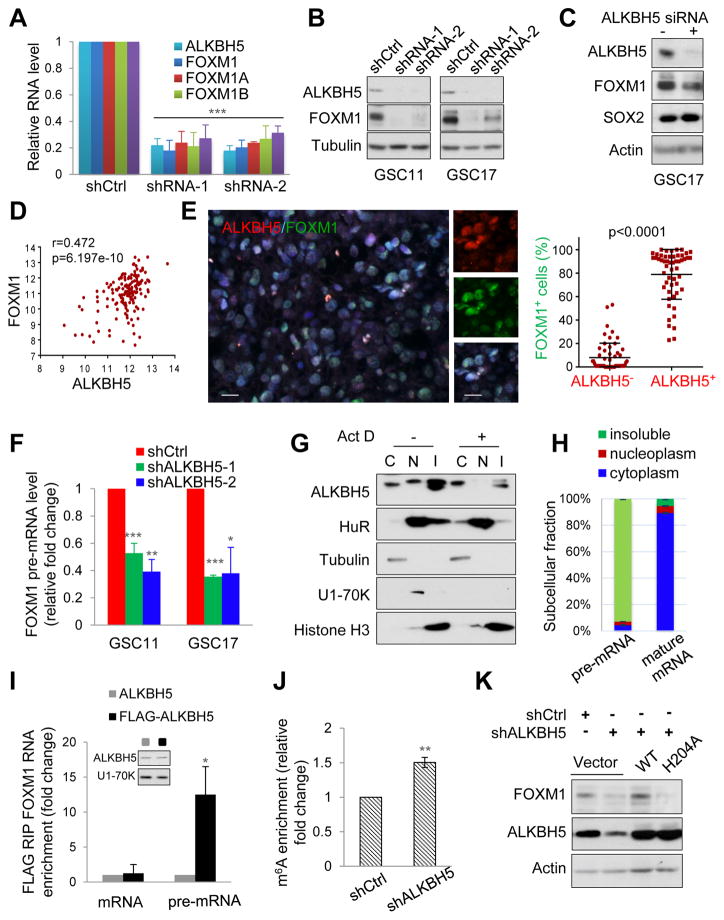
Figure 4. ALKBH5 Maintains FOXM1 Expression by Demethylating FOXM1 Nascent Transcripts.
(A) qPCR analysis of FOXM1 mRNA expression in GSC11 with or without ALKBH5 knockdown. Samples were normalized to GAPDH mRNA.
(B) Western blotting of FOXM1 in GSCs with or without ALKBH5 knockdown.
(C) Western blotting of FOXM1 and SOX2 in GSC17 cells treated with control or ALKBH5 siRNAs.
(D) Correlation between FOXM1 and ALKBH5 mRNA expression (RNAseq V2 RSEM [log2]) in the TCGA GBM data set.
(E) Correlation between ALKBH5 and FOXM1 protein expression in GBM specimens. Left, representative IF images of 15 GBM specimens. Scale bar, 20 μm. Right, in 5 random selected microscope fields of each tumor, the percentage of FOXM1 positive cells among ALKBH5 positive versus ALKBH5 negative cells was compared by t-test. Lines show mean and SD.
(F) qPCR analysis of FOXM1 pre-mRNA in GSCs with or without ALKBH5 knockdown.
(G) Cytoplasmic (C), nucleoplasmic (N), and insoluble (I) fractions of GSC11 cells treated with or without 5 μg/ml ActD (actinomycin D) for 2 hr were subjected to Western blotting for indicated proteins.
(H) Distribution of FOXM1 transcripts in subcellular fractions assessed by qPCR.
(I) RIP (RNA immunoprecipitation) analysis of transcripts from the nuclear extracts of GSC17 cells expressing exogenous ALKBH5 with or without FLAG tag. Enrichment of FOXM1 mature and pre-mRNA with FLAG was measured by qPCR and normalized to input. Western blotting of ALKBH5 showing equal expression of tagged or untagged proteins.
(J) MeRIP-qPCR analysis of m6A levels of FOXM1 pre-mRNA in GSC17 cells with or without ALKBH5 knockdown.
(K) Western blotting of FOXM1 in GSC17 with or without ALKBH5 knockdown and transfected with control, wild-type or mutant ALKBH5 plasmid.
All bar plot data are the means ± SEMs of 3 independent biological replicates. *p<0.05, **p<0.01, ***p<0.001.
See also Figure S4

