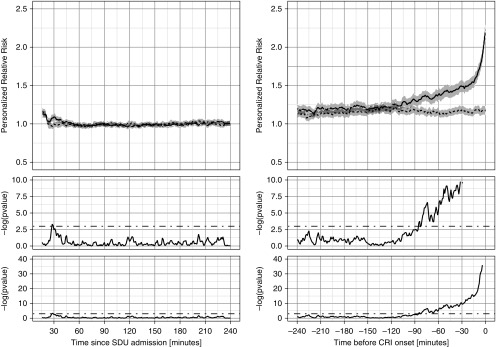
Figure 3.
Personalized relative risks (PRRisk). PRRisk subtrajectories aggregated separately for case (solid lines) and control (dotted lines; gray areas represent 95% confidence intervals) patients for the 4-hour stable period (left) and for the 4 hours immediately before cardiorespiratory insufficiency (CRI) onset (right). Time index 0 corresponds to time of step-down unit (SDU) admission (left) or CRI onset time (right). In the bottom plots, we show the P value series computed from two-sample t tests at each time point shown on the logarithmic scale. The middle plots are zoomed-in versions of the bottom plots. The cutoff threshold of 5% significance is shown with dot–dash straight lines.

