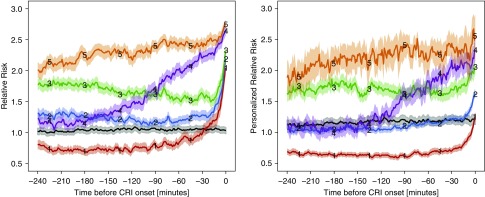
Figure 4.
Estimated trajectories of stratified relative risk (RRisk) groups and stratified personalized RRisk (PRRisk) groups. Estimated group trajectories for RRisk (left) and PRRisk (right). Time index 0 corresponds to cardiorespiratory insufficiency (CRI) onset time for both plots. Groups are color coded. The solid lines reflect mean trajectories estimated from all raw trajectories for the representative groups, as determined by the maximum posterior probability from the group-based model. Shaded areas depict the associated 95% confidence intervals. Separate groups that include sampled trajectories from all control subjects are plotted in black. 1 (red) = late onset low risk; 2 (blue) = late onset medium risk; 3 (green) = late onset high risk; 4 (purple) = gradual increase in risk; 5 (orange) = persistently high risk.

