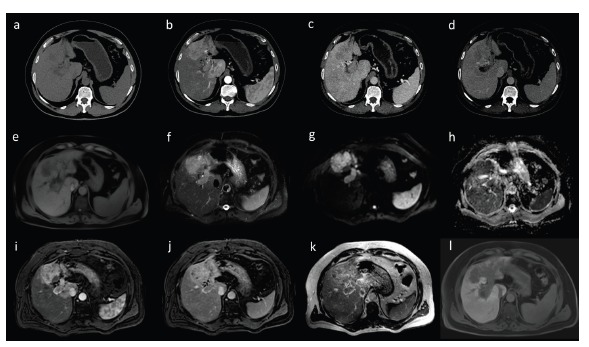
Fig. (17).

Diffused form of HCC with invasion of portal vein in CT (a-d) and MRI (e-l) in axial images. Strong enhancement is visible in hepatic arterial phase (b, i) with subsequent wash-out in portal venous (c, j) and equilibrium phase (d, k). Dynamic contrast-enhanced MRI was performed after administration of hepatocyte-specific contrast agent - HCC is typically hypointense in hepatobiliary phase (l). The lesion shows diffusion restriction with high signal in diffusion weighted imaging (g) and low signal in ADC map (h). T1-weighted (e) and T2-weighted images with fat saturation (f).
