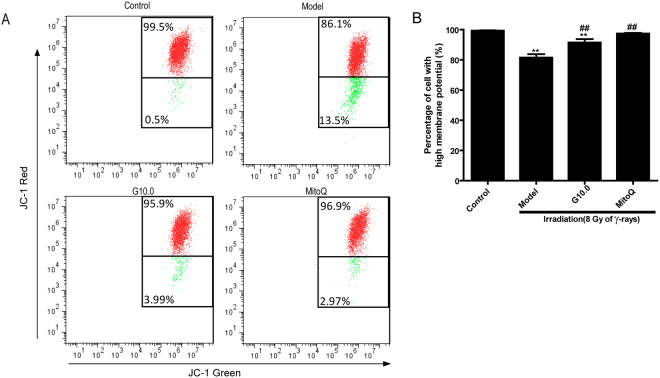
Figure 3.
Effect of GSPs on mitochondrial membrane potential in irradiated HFL1 cells. (A) Flow cytometry analysis of JC-1 staining was used to assess mitochondrial membrane potential (MMP). HFL1 cells were pre-treated with GSP (10 μg/ml) or MitoQ (200 nmol/L) for 24 h before irradiation, and MMP was determined at 72 h after irradiation. One representative flow cytometry plot of the mitochondrial membrane potential is shown out of three replicates. The cells with enhanced red fluorescence had a higher membrane potential. The numbers in the corners represent the percentage of cells in the corresponding quadrants. (B) The percentage of cells with high MMP (%) is shown. Data are expressed as the mean ± SEM of three independent experiments. *P < 0.05 and **P < 0.01 versus control group. ##P < 0.01 versus model group.

