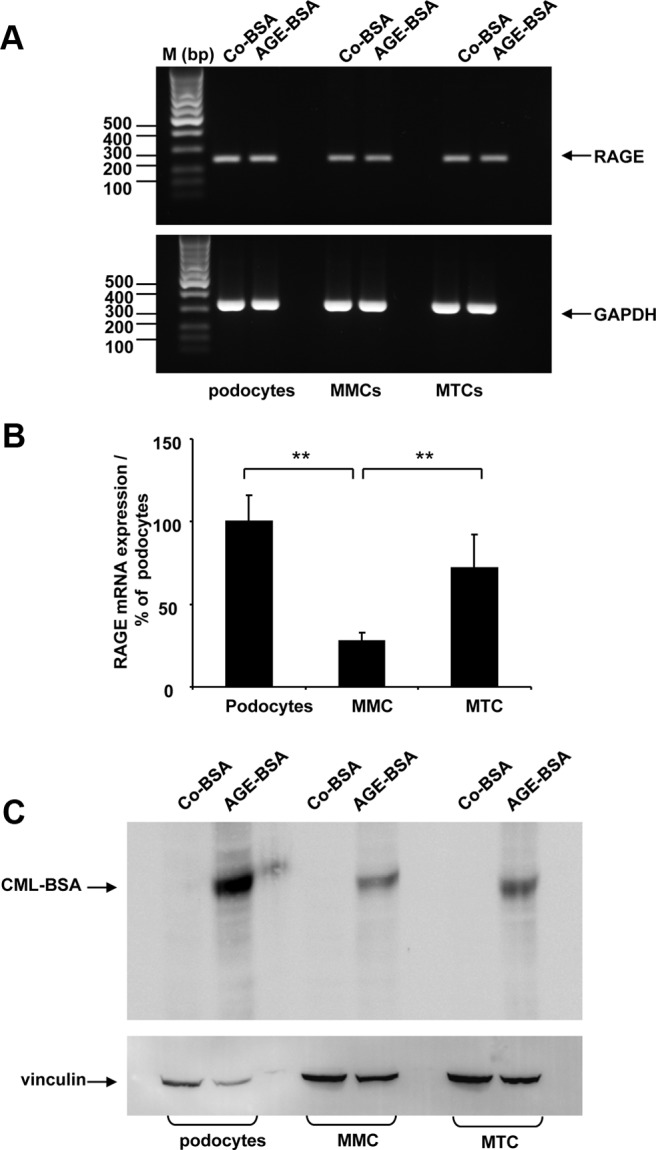
Figure 1.

A–C, Expression of receptor of AGEs in renal cells. A, Semiquantitative RT-PCR analysis of RAGE expression in differentiated podocytes, MMCs, and MTCs. Cells were treated with Co-BSA and AGE-BSA for 24 hours. Upper panel, Detection of RAGE expression; lower panel, analysis of GAPDH expression performed in parallel reactions from the same cDNAs. RAGE expression was detected in all cell lines. The molecular weight of the bands from the DNA marker is shown. The experiment was repeated three times with similar results. One representative image from the agarose gel electrophoresis is shown. B, Comparison of RAGE mRNA expression in Co-BSA-treated differentiated podocytes, MMCs, and MTCs by real-time PCR analysis. The expression of RAGE in differentiated podocytes was arbitrarily considered as 100%. Differentiated podocytes and MTCs show similar levels of RAGE mRNA, whereas MMCs revealed a significant lower level of RAGE mRNA. **, P < .005 vs podocytes (n = 9). C, Detection of CML-modified BSA (CML-BSA) in protein lysates obtained from differentiated podocytes, MMCs, and MTCs treated with either Co-BSA or AGE-BSA analyzed by Western blot. Immunological reaction specific for CML-BSA protein was present only in AGE-BSA-treated cells (upper panel). Protein loading was controlled by vinculin protein expression (lower panel). A representative Western blot from three experiments is shown.
