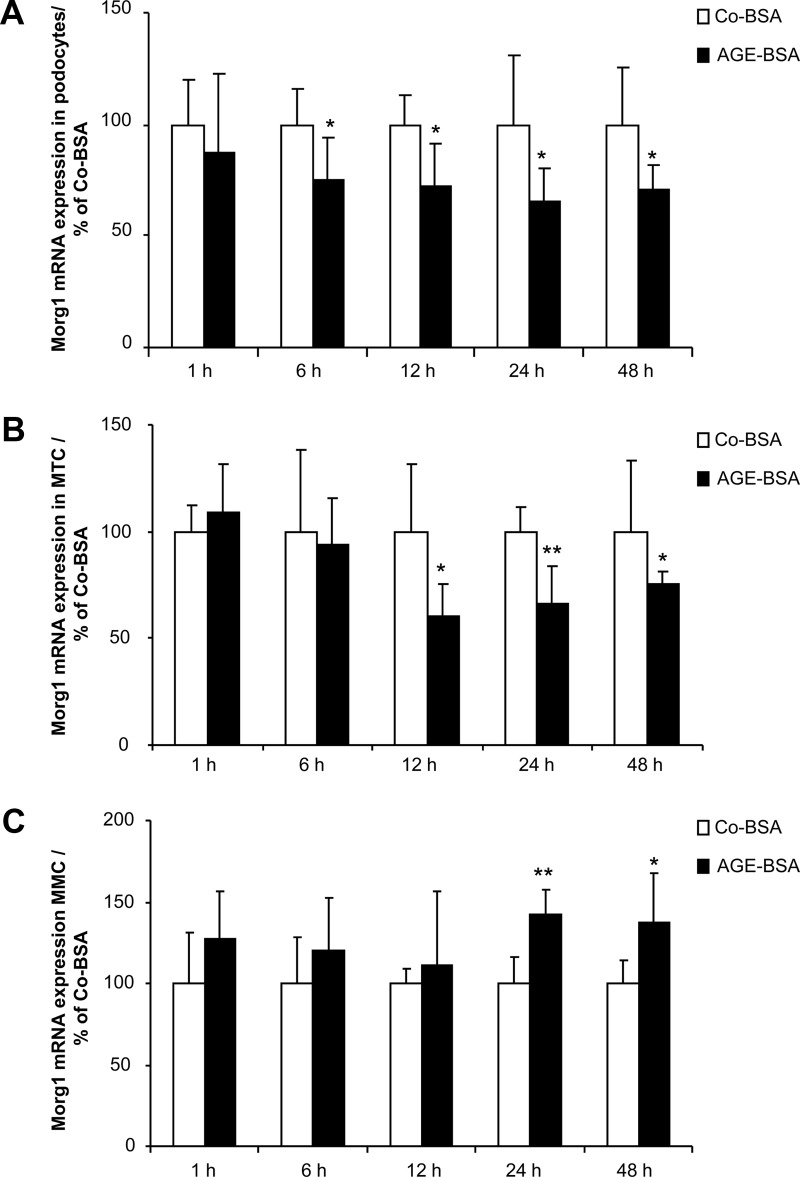
Figure 2.
A–C, Influence of AGE-BSA treatment on Morg1 mRNA expression in renal cells. Morg1 mRNA expression was analyzed by real-time PCR in differentiated podocytes, MTCs, and MMCs in a time-dependent manner from cells treated for 1 hour, 6 hours, 12 hours, 24 hours, and 48 hours with Co-BSA or AGE-BSA. Morg1 mRNA expression is presented in percent relative to Co-BSA treated cells for each time point. A, Morg1 mRNA expression in differentiated podocytes. AGE-BSA treatment significantly inhibits Morg1 mRNA expression starting from 6 hours up to 48 hours. *, P < .05 vs Co-BSA (n = 6). B, Morg1 mRNA expression in MTCs. Morg1 expression was significantly down-regulated in MTCs after addition of AGE-BSA from 12 hours up to 48 hours. *, P < .05; **, P < .01 vs Co-BSA (n = 6). C, Morg1 mRNA expression in MMCs. Addition of AGE-BSA increased Morg1 expression in MMCs after 24 hours and 48 hours of treatment relative to Co-BSA. *, P < .05; **, P < .005 vs Co-BSA (n = 6).

